We just released version 8.1 of our Visual Scheduling Widget Standard Edition (short: VSW SE) for HTML5 Gantt charts. With this blog post, we would like to inform you about three enhancements, to making your individual Gantt chart even more user-friendly.
Support of native overlay scrollbars for Firefox and Safari
The internal DOM structure has been redesigned so that the native overlay scrollbars of Firefox and Safari are now directly supported. This concerned Firefox on Windows 11 having a latency on mouse interactions because of special handling in our code, and it concerned Safari where no scrollbars were shown anymore. As a result, scrolling now shows no latency anymore on all browsers and platforms, but especially on Firefox.

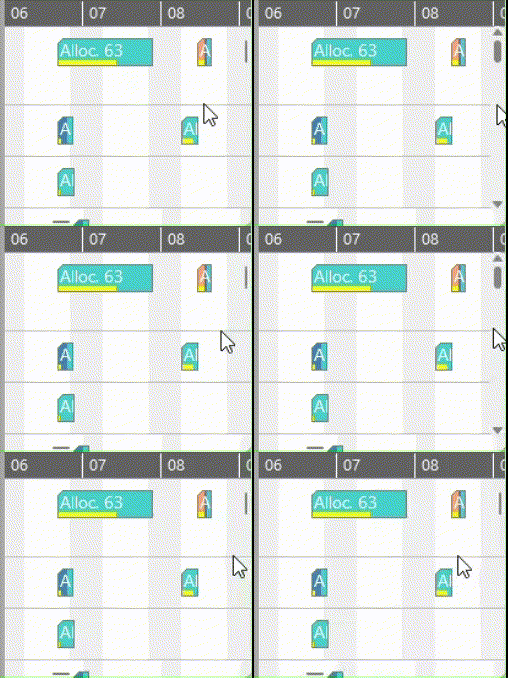
Improved visual feedback for hovering with the mouse cursor
To improve the visual feedback when the user moves the mouse cursor over a collapse or expand symbol or a sorting indicator in the table header, a shadow is now displayed in the background of the target symbol as known from other software:


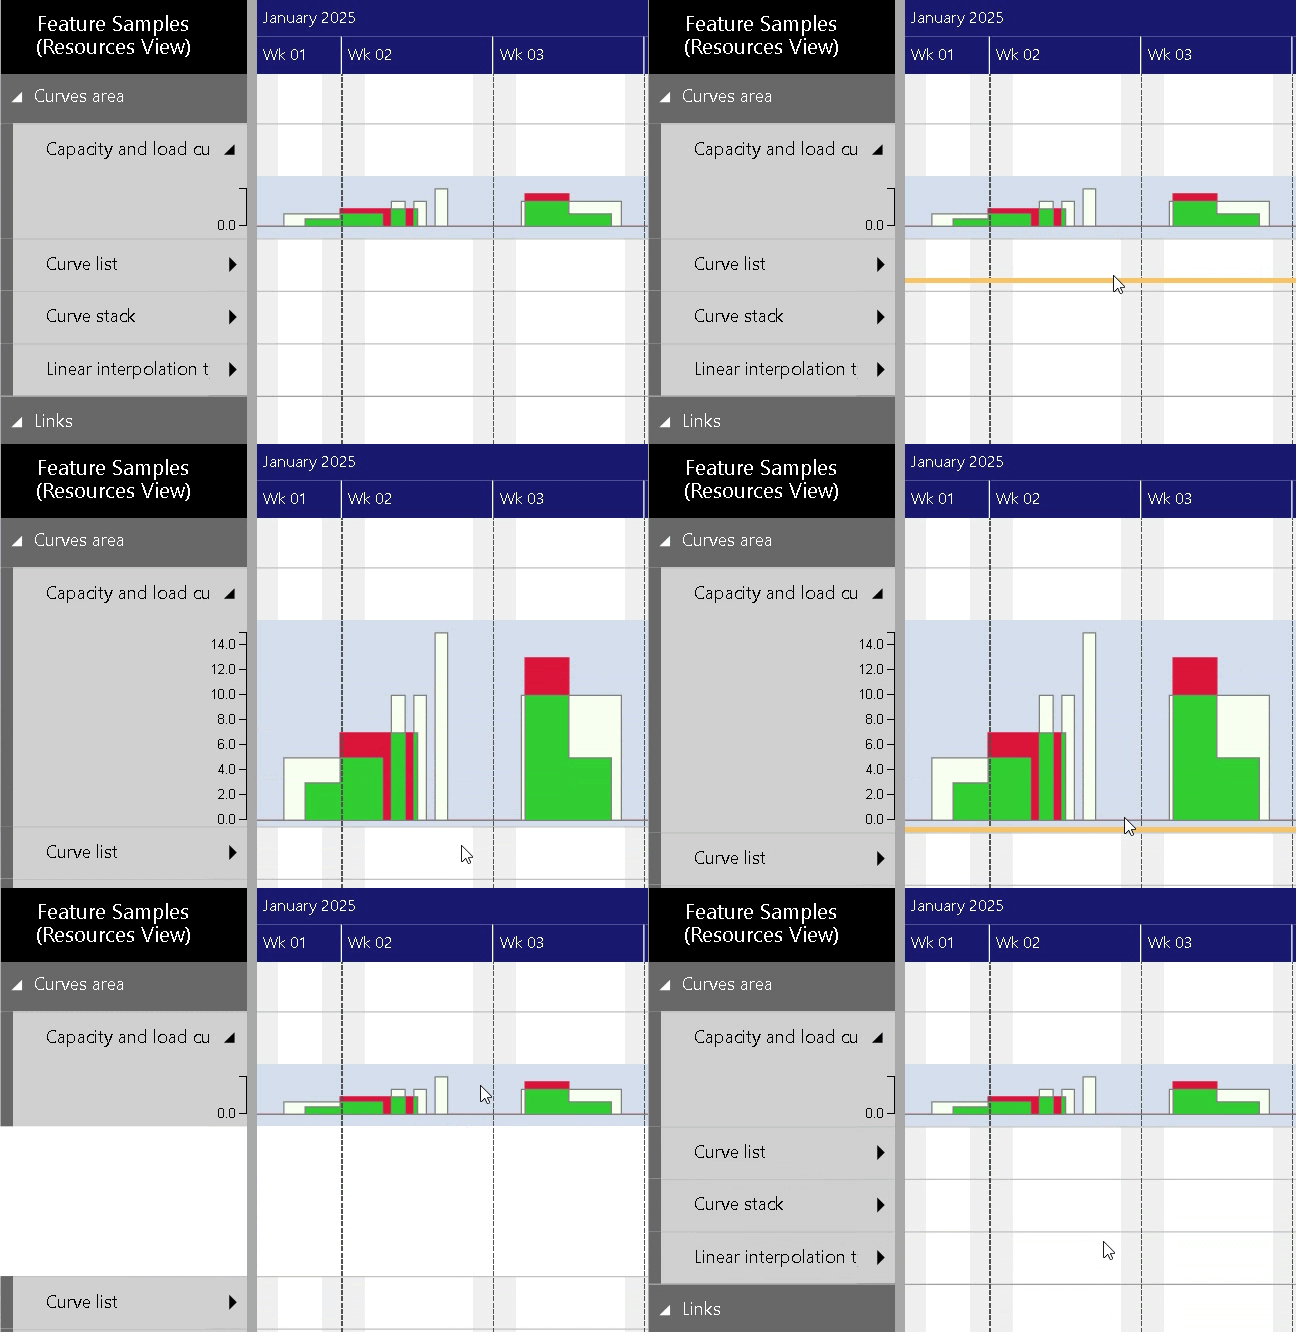
Interactive resizing of curve panes
Until now, the height of the curve panes was fixed. This was particularly annoying if you wanted to view the curve values in more detail. Therefore, we have added the new curvePanesResizable option. If this option is set to true, then the user can drag the bottom border of a curve pane and alter the height of the associated curve pane. The options minimumLoadResourceCurvePaneHeight and maximumResourceLoadCurvePaneHeight can both be used to limit the result of the user interactions up to the values of these options. The application is informed about this kind of user interactions by the new onCurvePaneResized callback.
In addition to the interactive changing, the height of each curve pane can also be set using the LoadCurvePaneHeight property of the resource object as before.

Features in previous releases

