
Our standard edition of the Visual Scheduling Widget (VSW SE for short) for HTML5/JavaScript Gantt charts has evolved excellently in the last few weeks. Driven by the requirements of our customers and by those of our own products we have enhanced the widget further and today we released a new version 3.2. SE. So, let me give you a brief overview of the most important extensions.
Overview of new features
Here are the main new functions of the Visual Scheduling Widget - Standard Edition, version 3.2.
1. Enhanced dateline features
So far, VSW SE allowed you to use date lines to mark points in time that you are particularly interested in. In addition to the already existing properties like for styling or labeling there are now further properties to specify the orientation and the positioning of the caption:
|
Orientation Horizontal
|
Orientation Vertical
|
|
|
Position Left
|
Position Center
|
Position Right
|
|
Position Top Left
|
Position Top Center
|
Position Top Right
|

In order to banish a date line in the background (that is, behind the bars), set its InFrontOfBars property to false:
|
InFrontOfBars true
|
InFrontOfBars false
|

Last but not least, you can now interactively drag the date lines when you set their Draggable property to true.
2. Highlighting of time periods
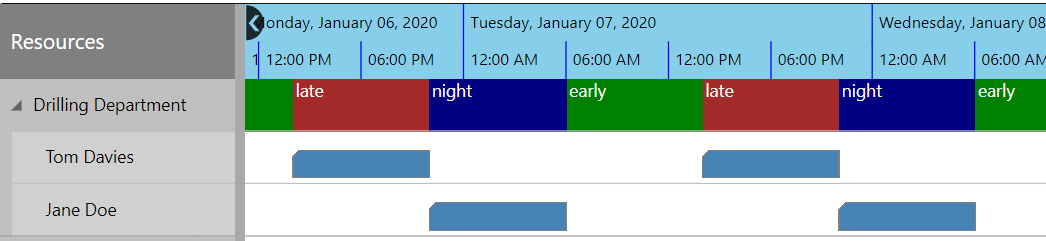
Suppose you want to display different work shifts (early, late, and night shifts) in the Gantt chart, or you want to mark exceptional time periods (lock times, maintenance work times and so on) for a resource, then it would be helpful to have a way of highlighting such times. VSW SE offers a new object for this: the period highlighter.
A period highlighter contains an array of entries, each representing a period of time specified by a start and end date. Each entry can have set a color, a caption, and a caption color. To give you the greatest possible flexibility, each activity and each resource can have its own period highlighter.
In the following screenshot you see a highlighter with several entries to display different shifts:
3. Visualization of suitable resources
When moving allocations interactively from one resource to another, the user often faces the problem of finding a suitable resource. This means, for example, that he or she is looking for a resource that matches the required skills. Usually the business logic can help here because it has the necessary information. It would be great if you could visually support the user in this situation, wouldn’t it?
Here is the solution for you: VSW SE offers a new allocation property for this purpose. For each allocation you can set an array of suitable resource identifiers (see allocation property SuitableResourceIDs). As soon as the user starts interacting, VSW SE highlights the suitable resource rows and "lowlights" the rows of resources that are not appropriate.
You can try it out for yourself by starting the sample application that we deliver with VSW SE. Please open the Feature Samples there, switch to the resources view and start moving the "Try suitable resources" bar. As you can see in the following screenshot, four rows are highlighted and the rest of the rows is darkened.
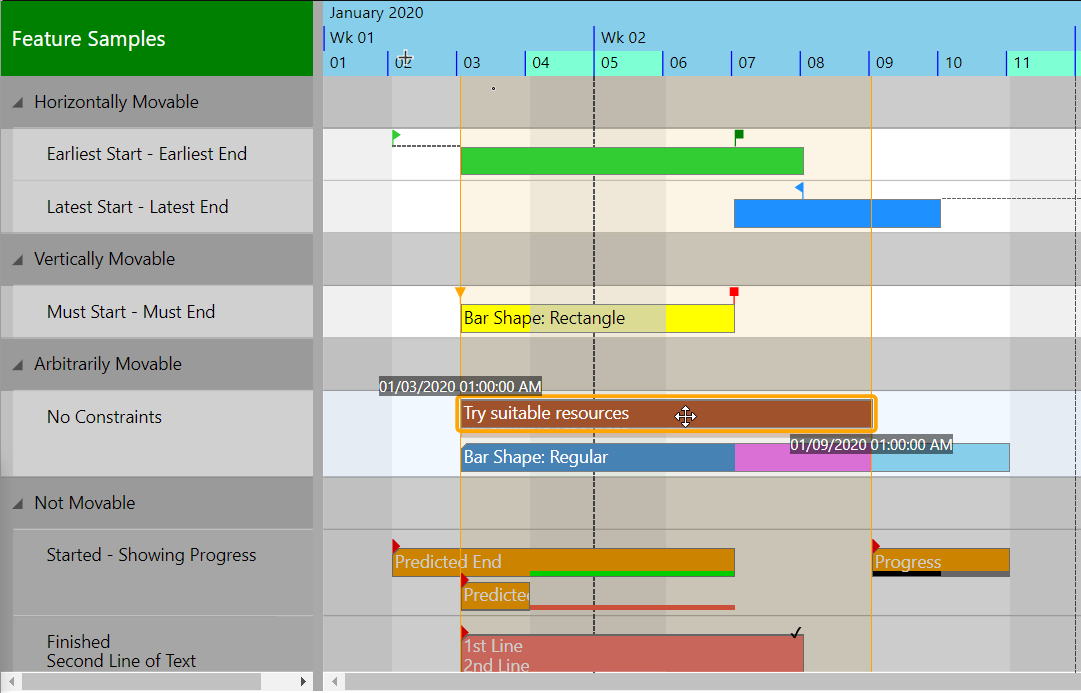
Please note, that this is a purely visual function. The user can drop a bar in each row and it does not matter whether the row highlighted or not. The application or rather the business logic is responsible for deciding whether the interaction is accepted or rejected.
To further support the user, it is possible to set the dropAllowed flag of the callback arguments in the onDrag callback to false depending on the row the user is currently hovering with the mouse cursor. On the one hand, this leads to a forbidden cursor appearing at the corresponding rows. On the other hand, no onDrop callback will be triggered if the user lets a bar drop on a forbidden row.
4. Support of time zones
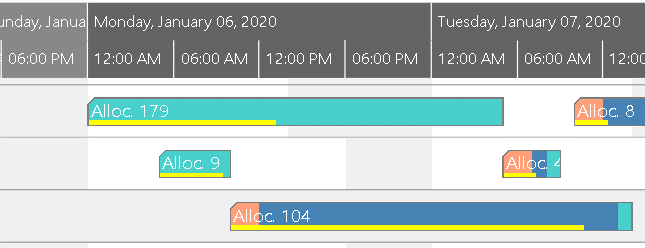
Especially companies that operate worldwide often work and plan across time zones. This can mean that a user in Europe, for example, might look at a Gantt chart that shows the scheduling for a manufacturing area in the United States. Per default, the user will see all dates related to the time zone of his local machine. However, it might be more useful to show him the schedule based on the time zone of the production location – in this case the United States. Therefore, we have introduced the new option timeZone in VSW SE.
The following example shows the same schedule, once from the perspective of the European time zone in Berlin and then from that of the New York time zone in the United States of America. As you can see, the only difference is a shift in the timescale.
Berlin
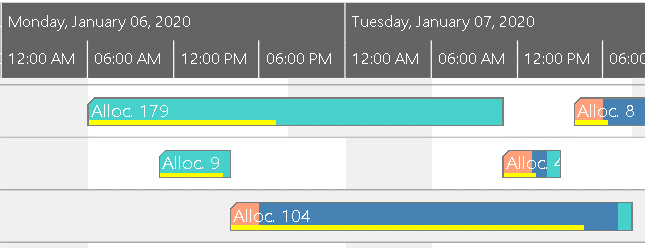
New York
To benefit from this feature, it is necessary to use the libraries moment.js and moment-timezone.js including the needed timezone data.
5. Miscellaneous
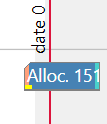
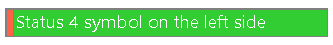
There are a lot of further extensions in version 3.2 of VSW SE. Besides the already existing three status symbols, a fourth symbol is now available at the very beginning of an activity or allocation bar, provided you are using a rectangular shape:
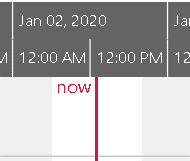
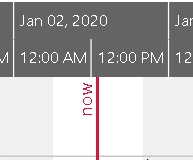
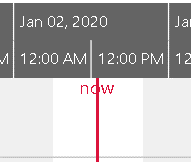
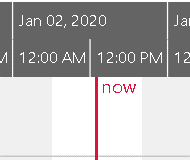
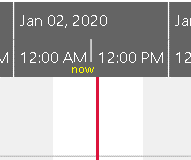
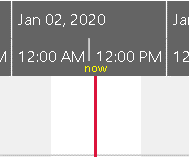
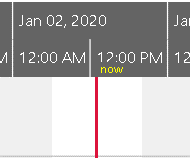
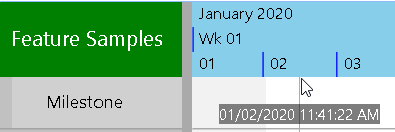
Another useful feature to give the user a better orientation when interacting with the Gantt chart is the cursor date line. When the user moves the mouse cursor over the chart, he will see a vertical line together with a label indicating the current time position of the cursor:
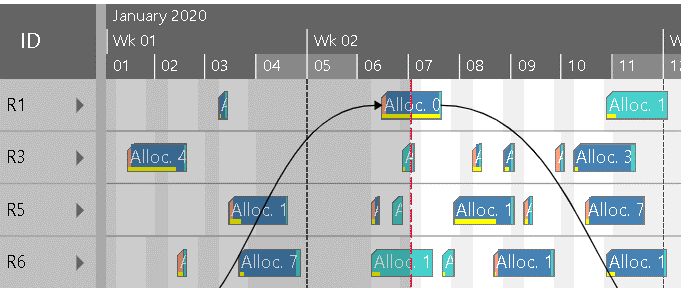
In practice, all past events and processes in a schedule are often no longer of great interest. Therefore, many of our customers have been looking for a way to visually reduce the appearance of these periods. For this purpose, we have created the possibility of specifying a special date (see option currentDate) up to which the time area is overlaid by a colored rectangle. The color – preferable one with transparency – is freely definable. In addition, the current date is visualized by a vertical line, which can also be styled. The screenshot shows an example with a transparent gray rectangle covering the past until January 7, with this date highlighted by a dashed red line.
For further new features, please refer to the detailed list in the chapter Changelog of the Interface Definition Document (IDD).
Next steps
I am sure many of you will benefit from all the new features of VSW SE. Feel free to download a trial version and create your own powerful HTML5/JavaScript Gantt chart.

The download includes the a sample application as well as the Interface Definition Document with the complete list of new features.
However, if you are missing some functionality, please do not hesitate to contact us (mailto sales@netronic.com) and let us talk about your ideas and requirements. We are looking forward to new challenges and we are ready to learn from your experiences and to further extend our product.