
With version 6.1 of the Visual Scheduling Widget Standard Edition (short: VSW SE) we released some enhancements and improvements that have been requested by our customers for some time but unfortunately did not find their way into the major release 6.0.
Visual segmentation of activities by entries
The ability to divide allocation bars into multiple segments is without a doubt one of the particularly useful features of the VSW. It can be used to visually highlight different time periods along with the overall duration of allocations. To achieve such a segmentation, the VSW provides so-called entries for the allocations, where each entry has a start and an end date and additional graphical properties like color.
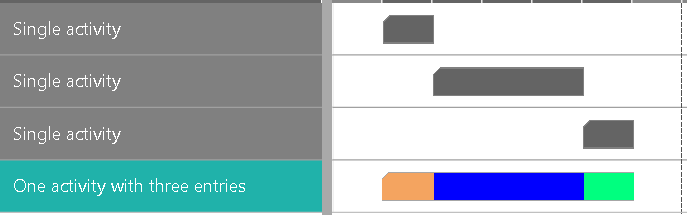
This powerful feature is now also available for activities. You can use the new activity entries, for instance, to highlight setup and teardown times as an alternative to model these times as standalone activities. The figure below compares a situation in which three related activities are represented once in separate lines and once in one line by means of activity entries:
Extensions regarding the resolution of the time area
The temporal resolution of the time area can be varied very flexibly by user interactions on the timescale. Using the mouse wheel, clicking on time ranges or the "up"-button on top of the timescale makes it easy for the user to alter the resolution.
However, sometimes it is necessary to set a specific resolution programmatically. This can be achieved with the method setTimeResolutionForView. We have extended the list of allowed resolution values by "week", "month", "quarter", and "year". As an alternative to these string values, you can also use values of the new TimeUnit enumeration.
The new options maximumTimeResolutionUnit and maximumTimeResolutionUnitfactor are helpful to prevent the user from stretching the time area too far. For example, if in a system the planning unit is "days", then it may not make sense to allow the user to dive into seconds-precise resolution.
And if your intention is to realize a fixed timescale, that is, one with a given resolution that the user cannot change interactively, then you will appreciate the new pm_timescaleInteractionMode option. Here you can specify, among other things, whether or not the user can rescale the time area by interactions on the timescale. Together with the method setTimeResolutionForView you get a time scale that is unchangeable in terms of resolution. Thereby the possibility for interactive scrolling will remain unless you disable it explicitly.
Enhancements of the interactions on bars
The timeStepUnit and timeStepUnitFactor options are both intended to control the increments in which the bars follow the mouse cursor while the user is moving a bar. This allows the user to position the bars in exactly the increments that correspond to the unit in which he wants to do his scheduling.
We have extended the permitted value range for the timeStepUnit by the values "week", "month", "quarter", and "year". As an alternative to these string values, you can also use values of the new TimeUnit enumeration.
Smarter data updating
Previously, when using one of the update methods, all properties of an object had to be listed, even if only one of them was to be changed. Apart from being annoying for the developer in his daily work, it is also inefficient in terms of the amount of data to be transferred from the server to the client-side. If, for instance, only the temporal position or only the color of an object changes, then until now all other object properties had to be transferred as well.
Both to facilitate the work of developers and to reduce the amount of data, we have added another update mode to the update methods: DifferentialValues. If this mode is enabled when calling an update method, the object data passed in this call need only contain the changed property values. This new update mode can be combined with the already available ImplicitAddObjects mode.
Grouping enhancements
One of the new major features in version 6.0 of VSW was the grouping. So far, it was possible to apply grouping in the Activities and the Resources View. Now, grouping can also be used in the Loads View.
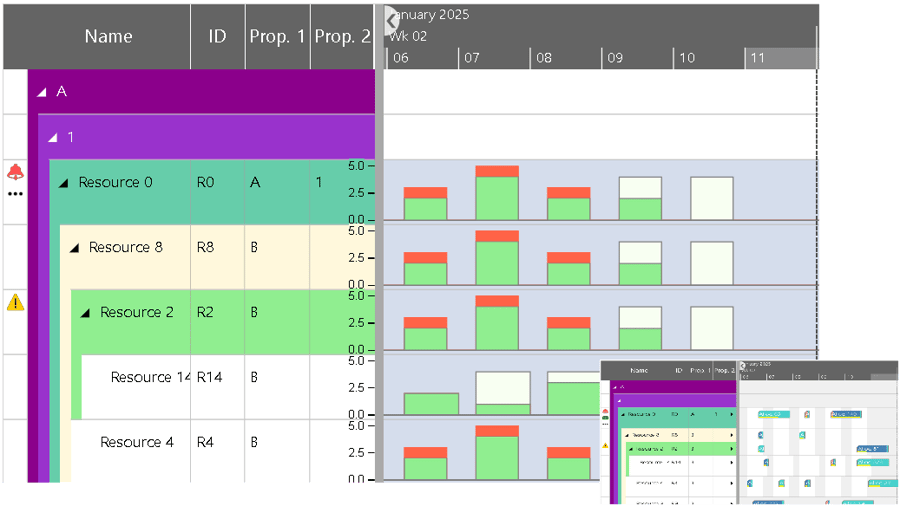
The figure below shows a sample for a grouping in the Loads View compared to its appearance in Resources View (small figure):
When defining a grouping structure for any item type (activity, resource, or entity), you have to specify from which data field the grouping code should be taken. This is working fine as long as each item to be grouped provides a value in the corresponding data field. However, if no value can be found because the field is either undefined or contains null or an empty string, then the item will be inserted into a specific group without any description in the table row.
To better support the user in such a situation, the new property DefaultCode has been added to the GroupingLevelDefinition object. Once no grouping code is found for an item, this item is assumed to have that default code and it will be inserted into the group built for this code instead. This way you can add semantics to the groups of items with unspecified grouping criteria.
Special symbol for notification about filtered allocation rows
When using the callback visibilityFilter for filtering allocation rows, the containing row showed a collapse or expand button even if all allocation rows were invisible. This tricks the user into clicking the button and then being surprised that nothing happens. Now, instead, a special symbol appears to notify the user that a row does not appear to have allocation rows, but they are just not visible due to some filtering.
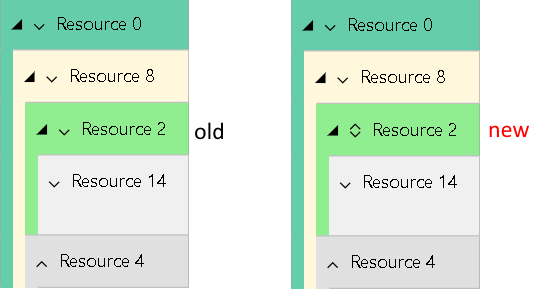
The following figure shows the old representation on the left side. Here you cannot see that Resource 2 has allocation rows, but they are filtered out and therefore you cannot expand Resource 2 by clicking on the down arrow. On the right side, the new symbol helps you to better understand and assess this situation.
Further readings
