
As we noted earlier this year, the pace of our developments has not slowed down despite the COVID19 pandemic. On the contrary, our entire team at NETRONIC has now learned to work even more efficiently through the intensive use of tools such as Microsoft Teams or Azure DevOps, for example, and through their close networking with each other, thus further increasing productivity. So, it is not surprising that we can now already publish another new major release of the Visual Scheduling Widget (VSW). Let yourself be excited by the innovations.
Save your HTML5 Gantt chart as PDF document and print it
To be honest, very long time we could not imagine that printing charts and working with the “oldfashioned” media called paper would be a highly desired product feature in times of web applications. We thought that anyone from anywhere with a web-enabled device – be it mobile or stationary - would have access to the up-to-date charts he or she needs at any time. But our customers have convinced us that for documentation and for presentation reasons or for a more straightforward way of communicating paper is still a very useful “tool”. Especially our long-time customers, who appreciate the rich printing functionality of our well-established products VARCHART XGantt and JGantt, have expressed their desire for a comparable functionality in the Visual Scheduling Widget. As accessing hardware – printers in this case – in the web browser is a particular challenge, we decided to enable printing by generating PDF documents. This solution allows you to use one of the many available apps for viewing and printing PDF documents. But the best thing about our solution is that in addition to the well-known options such as paper size, orientation, margins, etc., you can also use further very exciting features. The new saveAsPDF method allows you to pass a configuration object that lets you choose between three printing modes:
#1 Single print mode
Your Gantt chart is printed on one single sheet and the size of this sheet is determined by the size of the chart.
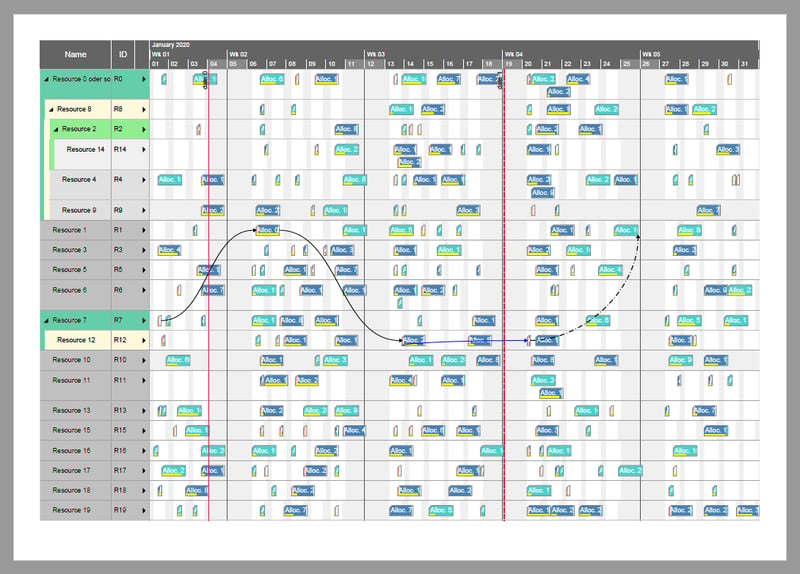
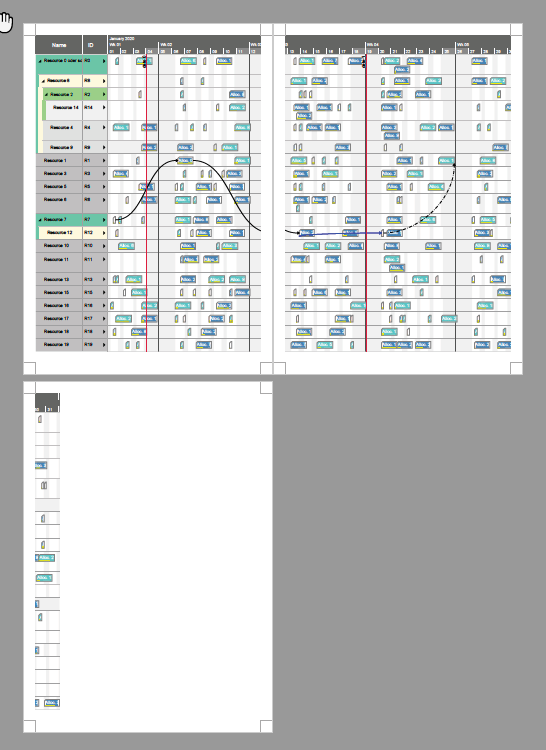
#2 Print mode with cutting marks
In this mode, you can output the diagram on several sheets. Additional cutting marks make it easy to reassemble the overall diagram from these sheets.
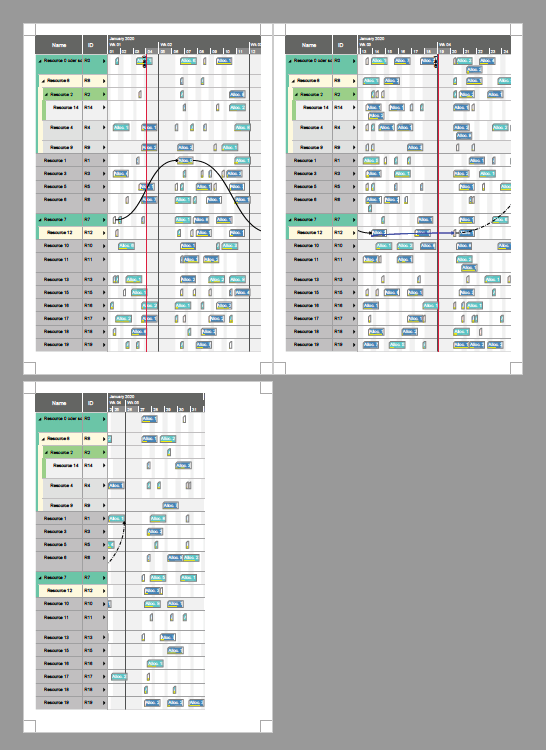
#3 Paging print mode
Also in this mode, you can output the diagram on several sheets. But here additionally on each sheet both the associated table section and the associated time scale section are printed. This is a very helpful feature if your focus is not on the entire chart, but if you want to consider the chart section by section.
Extend the activities focused Gantt view with important information
In the previous versions of the Visual Scheduling Widget, there was a strict separation between the items that were displayed in the Activities View and those that were displayed in Resources View. According to our resource scheduling model with the core object types
- Activity,
- Resource,
- Allocation,
you could see only the activities in the Activities View and the resources and allocations in the Resources View. Both views are like the two sides of the same coin. And if you wanted to see all aspects of a project at once, there was no choice but to display two widgets simultaneously, one with the Activities and the other one with the Resources View enabled. As of version 5.0, it is now possible to enhance the Activities View by additional allocation rows. For this, you can set the pm_allocationRowsVisibleInActivitiesView option to true. For each activity, the widget then looks for all allocations referencing that activity and adds a new row below the activity row for each allocation found:
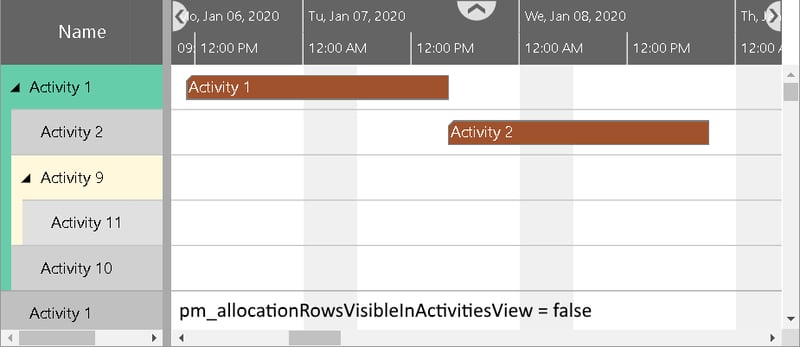
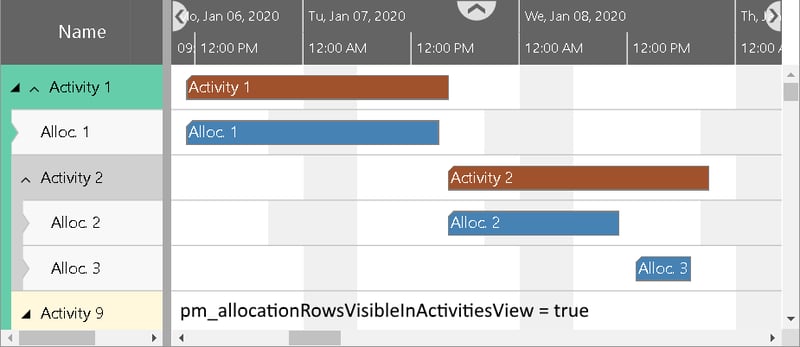
In the sample above, for Activity 1 only one allocation was found, whereas two allocations were detected for Activity 2. As you can see in the table at Activity 1, there is now another arrow. The left black one is for collapsing and expanding the nested activities, the new right arrow is for collapsing and expanding the allocation rows.
The allocation rows in the Activities View can be controlled by analogous options like the activity or resource rows. For instance, you can specify
- which table row definition an allocation row should use,
- whether it can be selected or collapsed,
- the minimum row height, and
- the design for collapsed and expanded rows.
And, of course, the application is notified by the onCollapseStateChanged callback as soon as the user changes the collapse state of the allocation rows.
Create HTML5 Gantt charts with watermarks
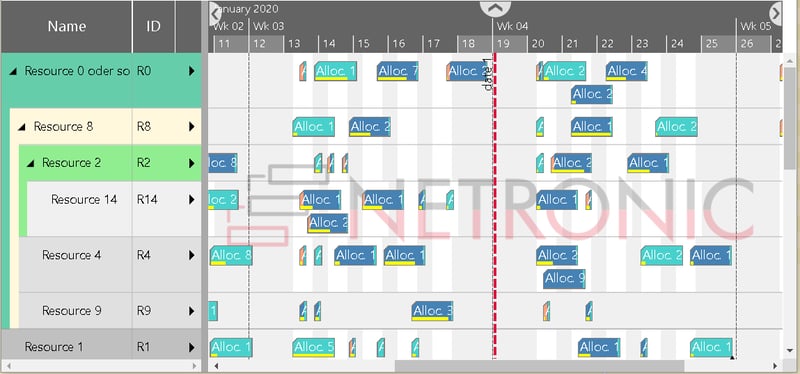
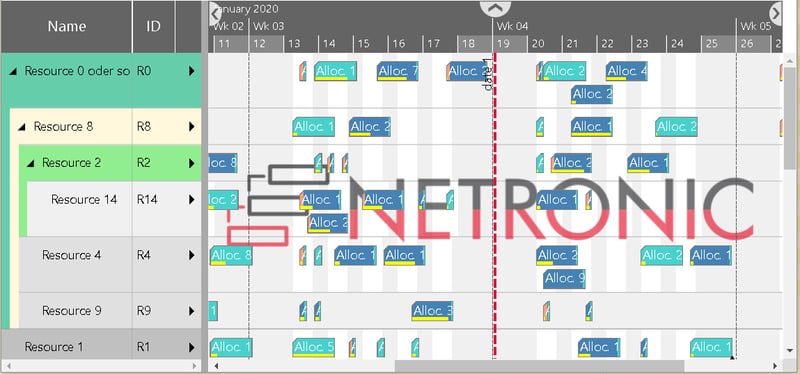
Sometimes you will have the desire to insert, for instance, the logo of your company in the background of your diagram. Or you may want to inform the user of your diagrams that the data to be seen is secret. For both situations, the Visual Scheduling Widget offers a solution by giving you the opportunity to use symbols as watermarks. To display a watermark in the time area of your Gantt chart, you can use the pm_watermarkSymbolID option to specify the identifier of a symbol to be used as a watermark. Also, you can use the pm_watermarkOpacity option to reduce the opacity of the symbol so that it becomes paler and less prominent. In the following figure, the opacity has been set to 0.2 (default) and 0.6, respectively:
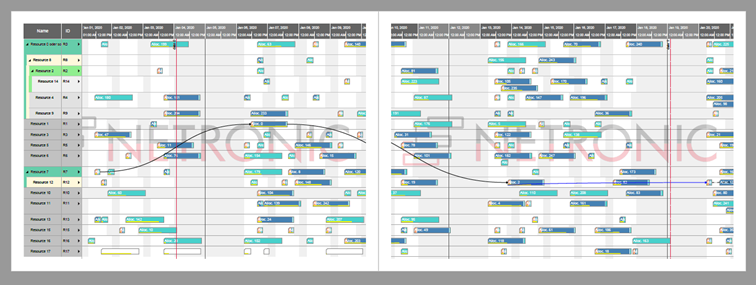
When you save a Gantt chart to a PDF file using the method saveAsPDF, the watermark is printed as well, of course. But in this case, it will be placed in the center of each sheet, as you can see in the next figure for a PDF file with two pages:
To have the watermark only in the PDF but not in the chart on the screen, you can define the identifier for the watermark symbol using the watermarkSymbolID property of the additional saveAsPDF configuration object parameter instead of the pm_watermarkSymbolID widget option.
widget.saveAsPDF
( "yourFileName",
{ // This is the configuration object.
watermarkSymbolID: "yourSymbolID"
}
);
The pm_watermarkOpacity option will also be considered in this case.
More design options for the bars
We have extended the options for designing the activity and allocation bars. You can now set the opacity of the bars by using the PM_BarOpacity property of an activity or allocation object. Reducing the opacity affects the entire bar, that is, also the borders, the progress bar, the symbols, and the constraint dates:
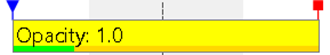
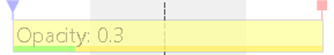
As you can see, this feature is especially useful for visually reducing bars, for example, when they have less importance than the rest of the bars.
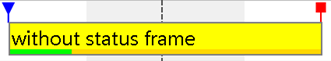
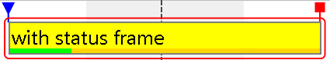
In addition to the four status properties, there is now another option to express a status at an activity or an allocation. Using the pm_statusFrameVisible and pm_statusFrameColor properties a bar can be additionally highlighted:
Finally, constraint dates are now displayed when using summary or diamond bar shapes. And for diamond shapes, the PredictedEnd dates are no longer ignored but are now also visible in the Gantt chart.
Show links between allocations
Starting from this version of the widget, links can be defined not only between activities but also between allocations. For this, the link object has been extended by the properties SourceAllocationID and TargetAllocationID. With the new options pm_definedAllocationLinksVisibleInActivitiesView and pm_definedAllocationLinksVisibleInResourcesView you can decide if and where these links should be displayed.
Extensions for the Gantt chart table and the entities table
Color your table row cells
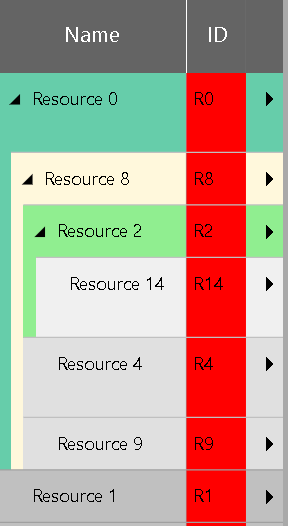
Many customers were missing an option to highlight only a single cell in a table row. Therefore, the VSW offers now the new BackgroundColor property for the TableCellDefinition object. For instance, if you set this property to red in the second cell definition of a table row definition, the corresponding cell in each table row that makes use of this row definition will be colored red. This is what just happened in the following sample:
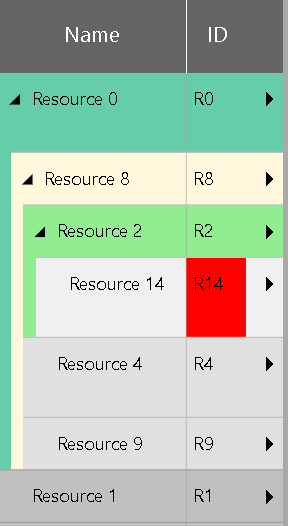
But this is not flexible enough! In most cases, you do not want to color all cells of a column, but only certain cells depending on the specific data of a table row. For this purpose, you can use the BackgroundColorSource property instead of BackgroundColor. Here the widget expects a reference to a property of the current data object from which it can take the respective desired color.
Of course, all this makes only sense if you can also alter the color of the cell texts to ensure that all texts are readable in any case. For this, the widget provides for each cell definition the properties TextColor and TextColorSource, which work in the same way as the properties described above. Altering our sample accordingly – we have set “white” in the object property referenced by TextColorSource – results in:

Add symbols to column
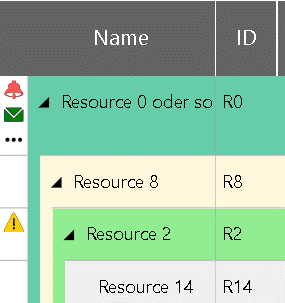
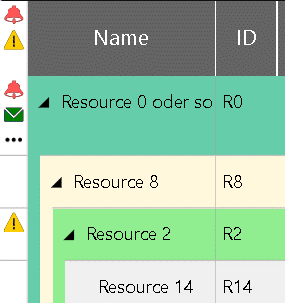
The next improvement is related to the title of the symbol column. This column is a valuable tool for “projecting” important events that occurred anywhere within a Gantt row or entities table row to the very beginning of the corresponding row. We have now taken this idea further and also created the option for the symbol column title to display symbols there in the same way. This allows you to project important events from inside the symbol column onto the column title. The options relevant for this feature are:
- pm_symbolColumnTitleVisible and
pm_symbolColumnTitleSymbolIDs for the Gantt table and - pm_entitiesTableSymbolColumnTitleVisible and
pm_entitiesTableSymbolColumnTitleSymbolIDs for the entities table.
The next two screenshots show the difference between invisible and visible symbol column titles:
So far you could only set the table view width for all three view types (Activites, Resources and Loads View) at the same time. The new widget options tableViewWidthInActivitiesView, tableViewWidthInResourcesView, and tableViewWidthInLoadsView give you the chance to define the width for each view separately. If the user changes the view width of the table in one view type, then the widths in the other views will be adapted as well unless the option tableViewWidthsSynchronized is set to false.
Miscellaneous
The method removeAll is now more flexible. Instead of removing all objects that have been added before by using one of the add… methods, you can now specify which type of objects you want to remove. This way you do not have to collect all the objects to be deleted or their identifiers in an array to invoke one of the type-specific remove methods with them.
Finally, there is a new option called pm_scrollOffsetsChangedCallbackTimeDelay that determines the time delay in milliseconds for triggering the callbacks onVerticalScrollOffsetChanged and onTimeAreaViewParametersChanged. This serves for special cases where your application needs more or less callback triggers.
It goes without saying that we have continuously worked on performance improvements and on the stability of the product in this version of the VSW as well.
Important announcement for users of IE 11
The days of Microsoft Internet Explorer 11 are numbered. Nevertheless, we still support this browser with our current Visual Scheduling Widget. However, as the current modern browsers become more powerful and allow to run modern JavaScript code that is easier and faster to develop than with older versions of JavaScript, we decided not to miss the new possibilities and opportunities. Therefore, we will stop supporting Microsoft Internet Explorer 11 at the end of 2021. If it is foreseeable that this decision could cause you unsolvable problems, please contact us.
Interesting stuff about Gantt chart visualization
Here are some helpful visualization tips for HTML5 Gantt charts, published on our blog recently:
Backlogs in HTML5 Gantt charts: visualization tips with the VSW
Individual resource working times in an HTML5 Gantt chart - our VSW tip
