
In production or project planning the scheduling of backlog items is an essential task. It is important to keep an overview of all work to be done and to include the items step by step in the planning board. In a previous blog post we have already discussed different backlog visualizations. Now, we will see how our Visual Scheduling Widget can help you to perform the handling of backlogs by using Gantt charts.
Two dimensions to be observed when scheduling the backlog
A backlog consists of a breakdown of all the work to be done to meet the requirements for instance on a product. The work items may be structured as a linear list or as a hierarchy. In principle, the task is to
- assign all work items to resources and
- to time them appropriately.
Depending on the concrete situation, one of these two dimensions may or may not be predetermined.
Now I will show you two ways of a backlog visualization and how to create it with our Visual Scheduling Widget. The first sample focuses on scheduling items without a specific start or end date. The second sample illustrates the case of items which already have a scheduled start and end date, but should be allocated to a resource.
Backlog visualized by entities table
With the Visual Scheduling Widget you can create an entities table which is shown in the area on the right of the Gantt chart (see red frame in the picture below) when you set the option entitiesTableVisibleInActivitiesView or entitiesTableVisibleInAllocationsView:
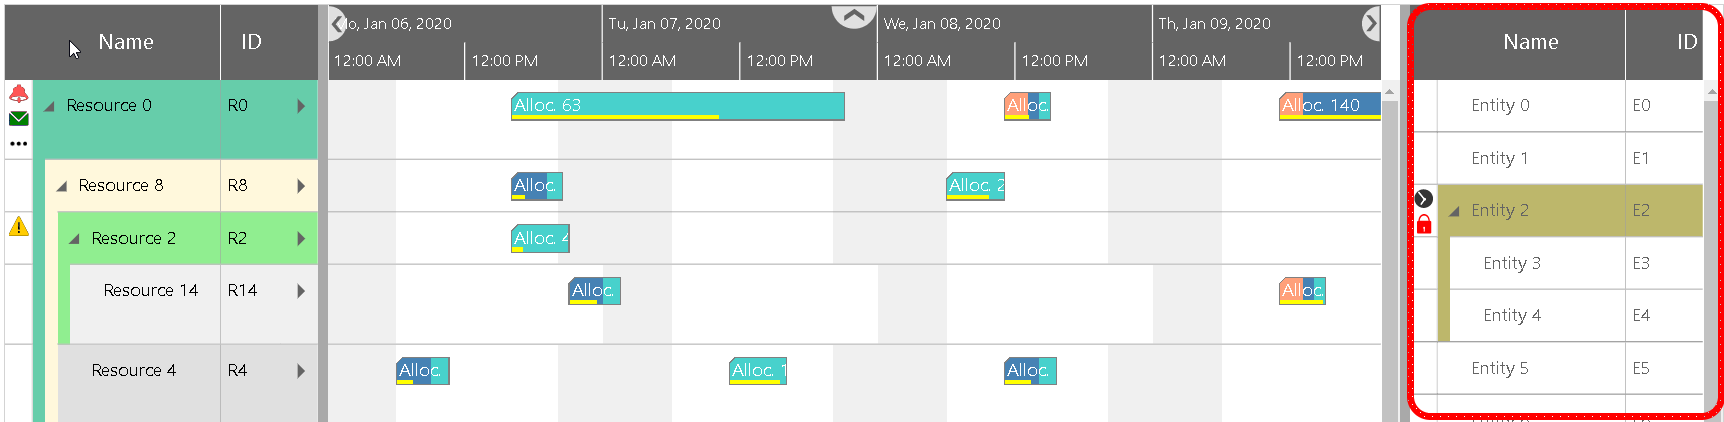
The entity table has the same functionality as the regular table of the Gantt chart. You can nest entities, color the rows, use a symbol column, and scroll the table independently of the Gantt chart. However, the most important feature is that you can interactively drag an entity from this table to the Gantt chart:
When doing so, you can move the entity horizontally and vertically across the Gantt chart and then let it drop at the desired position.
Entities can have a predefined duration. In this case, the duration will be taken into account and the phantom bar that appears during the interaction will adapt its length depending on that duration. The calendar of the resources over which the phantom is just hovering is also considered in this process.
So, the entities table allows you both to assign work items to resources and to determine their position in time in one step.
Backlog visualized on top of the Gantt chart
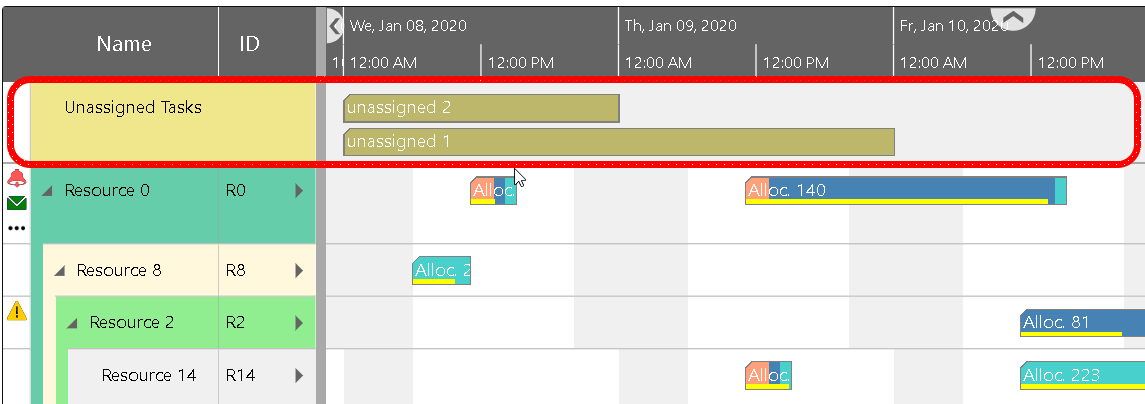
If the work items are already scheduled with respect to their time position and if it is only a matter of finding a resource that can process this item, the Visual Scheduling Widget offers another way to support the user in this task. You can enable the top view area by setting the pm_topViewAreaVisible option. This will cause an additional area to be displayed where you can place items with defined start and end dates:
To add a resource to this top view area you have to set the PM_ViewArea property of that resource to netronic.nVSW.ViewArea.Top. After that, the user can drag any allocation bar from the top view to the regular area and back again.
To prevent the user from accidentally altering the time position of a bar, you should only enable the DragVertically flag in the property PM_AllowedBarDragModes. Otherwise, the user can change both the assignment to a resource and the start and end time of the allocation interactively.
Please note: Currently, the top view area is available in the resources view only.
How visualization can support planners to find suitable resources
It does not matter whether you are using the top view area or the entities table - in both cases the problem of quickly finding a suitable resource may occur. And with this I do not mean merely finding a resource that has time to work on an item but instead finding a resource that has also the necessary skills to do the job.
You can solve this problem and help the user by using the allocation property SuitableResourceIDs. Here you can define an array of identifiers of those resources the user should choose from. As a result, when dragging an allocation bar, all resources that do not match the necessary skills (i.e. that are not listed in the property) are covered by a semi-transparent curtain. In the following figure you can see that the user is just dragging the allocation unassigned1 and that only Resource 2 and Resource 14 are suitable:
Please note that this is only a visual aid for the user. He can still let an allocation drop on a "disallowed" resource. It is up to the application to react on the user’s action and to accept or reject his intended modification.
We also made a video about how to handle backlogs in Gantt charts. Here is the link.
Next step
Interested in learning more about the versatile functions our Visual Scheduling Widget offers? Why not start with our Hello Gantt World video that shows you how to build your first HTML5/JavaScript Gantt Chart within 6 minutes.
And if you want to test the widget immediately - here is a free download:
