In spite of the steadily growing automation, many small companies still plan their orders manually. Ideally, they use an interactive planning board for scheduling support. In this case, the order backlog (also called order pool or stock of orders) is an important part of this planning board. We have different ways to visualize this backlog for our customers, the presentation depending on whether the orders consist of several sub orders or not, e.g. For all of you dealing with Gantt charts and manual planning I have summed up four visualization versions.
Small make-to-order manufacturing companies usually don’t have a PPS system planning their orders and tasks automatically, since their manufacturing process is not standardized enough or their order volume is too low. Often, they plan their orders and allocations intuitively. This planning strategy works fine as long as the order volume is low. With the number of incoming orders increasing, however, these companies seek support in a planning board that allows manually allocating orders and at the same time provide an overview of the orders in the manufacturing process. For these companies is it that we develop tailor-made interactive planning tables with an integrated pool of orders or order backlog which allows to simply drag and drop the orders and tasks to the resources. There are different ways of visualizing such a backlog that depend of the manufacturing process and the planning focus.
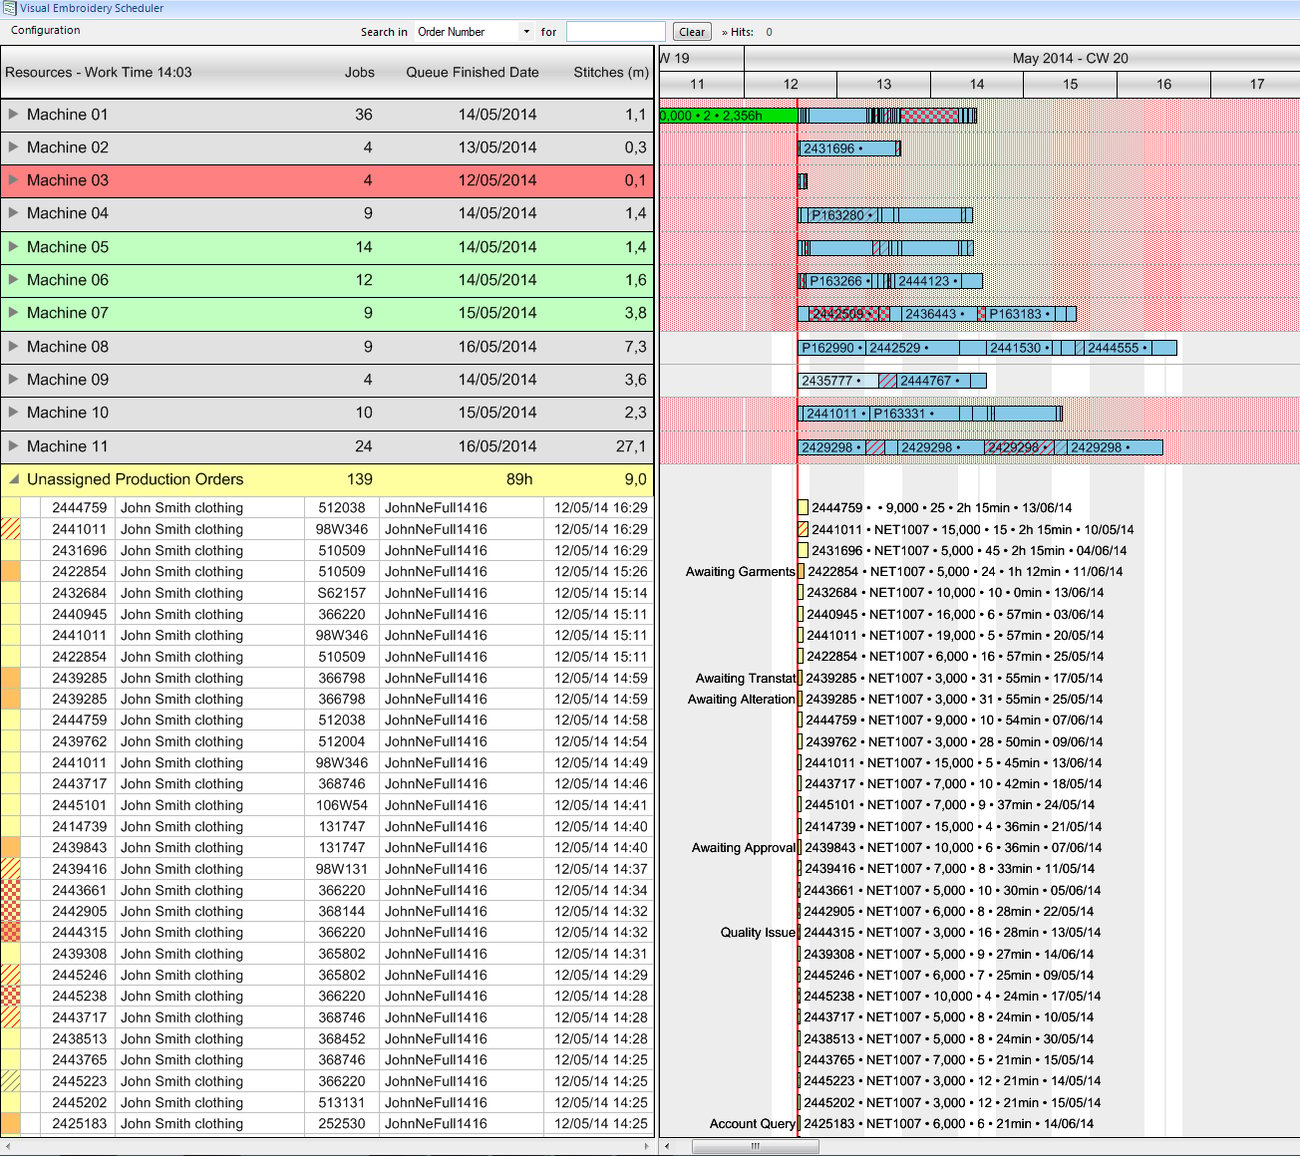
#1Daily planning: Going by the time-now line
Together with our customer Dickies, who has to place embroidery orders on their machines, we have developed this visualization version. By context menu or by drag & drop the planner allocates the not allocated orders to a machine. The order having been allocated by context menu automatically queues up at the end of the orders waiting at this machine and can also be moved from there, if necessary. It is also possible to place a not allocated order by drag & drop at a certain place in the queue directly – e.g. between two waiting orders. The list of the not allocated orders can be filtered/sorted by several criteria. Read more in our success story.
#2 Orders with similar durations focused on a response date
If orders have quite similar processing times or only short durations, it could be reasonable to place a Gantt chart with a backlog below or above the allocation plan. For instance, the not allocated orders will be placed on the response date if the planning focus is upon this date. In this case, employees’ deployment will be planned that are always booked for a certain day. The advantage of this visualization form is the comfortable drag & drop handling. The planner moves vertically, upwards or downwards as fast as possible, to the selected resource, very closely keeping in view the date the order is focused on.
#3 Hierarchically structured orders
Orders with several sub-orders can very well be presented in a tree structure that visualizes the hierarchical structure of the single orders. If the structure is collapsed, the planner sees the number of not allocated orders at one glance. If he expands one of them, the belonging sub-orders can easily be moved to the Gantt chart by drag & drop.
#4 Order details important for planning
Visualizing a backlog in a table is quite similar to the tree structure but in many cases this form is better suited. In a table, the order with its sub-orders can also be displayed in hierarchical form. However, a table offers one crucial advantage: It allows to display much more information on the orders to be planned and in a much clearer manner. Moreover, filters are available that let the planner list orders in the backlog by certain criteria. If intermediate products have to undergo different control tests, the orders can be filtered by a certain test regulation so that they can run in a row preferably.
In this sample resource A is one machine, resource B is a group of machines, that can excecute the operation in parallel. The application includes a function that splits the operation automatically to optimize the use of capacities.
Further information
The representation forms of backlog #2 and #3 are taken from our application Visual Service Scheduler for Microsoft Dynamics NAV where users can choose between both backlogs. We also did a blog once about our customer Service4CtS: Customer Case: More Control of Service Deliveries With Dynamics NAV
Our planning boards are realized with our Gantt components VARCHART XGantt and VARCHART JGantt. For some time now, we have also been developing individual web-based Gantt chart widgets based on HTML5/JavaScript basis for our customers.
If you have any question regarding backlogs and the visualization in HTML5, .NET, ActiveX or JavaBean, please feel free to contact us. We are looking forward to your requirements and ideas.