
The current COVID-19 pandemic does not cause us to slow down or even stop the development of our standard edition of the Visual Scheduling Widget (VSW SE for short) for HTML5/Javascript Gantt charts. Quite the contrary! It has never been so important for us and our customers to use the time for further developments and improvements. Let's take a look at the latest achievements.
Choose your cutout in a large Gantt chart interactively
As great as Gantt charts can be, sometimes it is hard to quickly scroll from one chart area to another. Especially with large charts, it is a challenge to scroll to the desired area on the first try if the target area is far away from the originally visible area. Also, the fact that both horizontal and vertical scrolling is usually required at the same time can make this an annoying task.
We are very excited that we can now provide you with a very useful tool to help you master this challenge: the world view.
By setting the option worldViewVisible you can have this view displayed. By default, it will appear at the bottom of the VSW SE. However, you can change its position as well as its extent. The world view shows the entire Gantt chart as rough sketch with two rectangles inside it: one represents the currently visible area of the table part and the other one that of the time area.
As soon as you drag one of those rectangles, the chart is scrolled accordingly. And, of course, you can also scroll the chart in the conventional way for instance by using the scrollbars and the rectangles will alter their position accordingly.
We are sure, that you will really love this new feature to make your users’ lives more comfortable.
Drag multiple bars at the same time
One of the main concepts of VSW SE is to give the application the full control over the data. That is, VSW SE will never modify your data, even if the user has interactively changed elements within the Gantt chart. Instead, VSW SE calls callback methods in this case to notify the application about the user’s intentions, and the application can then modify the data accordingly.
Sometimes a good user experience comes up short with this approach. For instance, think of chains of activities or assignments. Very often, such chains represent interrelated structures that have a fixed temporal dependency. That is, moving one element means that all dependent elements have to be moved in the same way as well.
So far, the user can select multiple bars, but as soon as he starts moving one of them, only a phantom of that bar moves:
As of VSW SE 4.0, this behaviour has been enhanced. Now you can switch on the option multipleBarDraggingEnabled which will cause VSW SE to create phantom bars for all bars to be dragged. If the user now dragges a set of selected bars, he will see all these bars moving together:

This gives the user a better idea of what will happen after he has dropped the bars.
Use symbols for more additional information for the planner
With this version, we have extended the possibilities to add additional semantics to table cells and bars by symbols. So far, you can only use the symbol column in the table part for this purpose or attach symbols to the upper left or right edge of the bars.
Now it is also possible to place symbols inside the “regular” table cells or to have them at the left or right inside the bars:
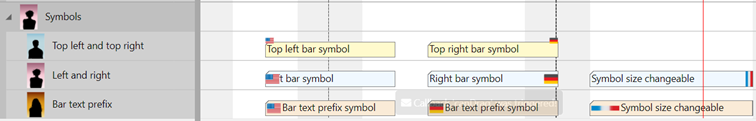
For this, we have added the new property SymbolIDSource to the table cell definition of VSW SE. Use this property to reference a data field of a resource or activity from which the widget should get the ID of one of your custom symbols that you have previously added to the widget. For each table cell that depends on such a cell definition, the widget will look for the symbol accordingly to the data of the associated table row.
The symbol will obey the HorizontalAlignment property and can be used together with the TextSource property. In this case, and if the alignment is set to “Left”, the text is indented to avoid overlapping with the symbol.
For activity and allocation bars, we have the new properties PM_LeftBarSymbolID PM_RightBarSymbolID, and PM_BarPrefixTextSymbolID. These properties allow you to directly reference the symbols. As you can see in the last two rows of the figure above, they are placed at the left and right side inside the bars. The difference between the PM_LeftBarSymbolID and the PM_BarPrefixTextSymbolID property is that applying of the latter one will displace the bar text to the right.
The size of the bar symbols at the new positions can be set individually for each bar.
Benefit from improved loading performance
When developing software, performance is always an important topic and we are constantly working to improve our products in this regard. However, it is advisable to have a closer look at the performance of our products from time to time. That is exactly what we did with this release. Accompanied by a lot of restructuring work, we focussed this time on the loading performance. We are really proud having achieved a respectable enhancement.
The following chart shows an excerpt of our performance test series. It shows the improved loading times of the new released version 4.0 compared to those of the old version 3.2 of VSW SE taking some representative test cases as an example.
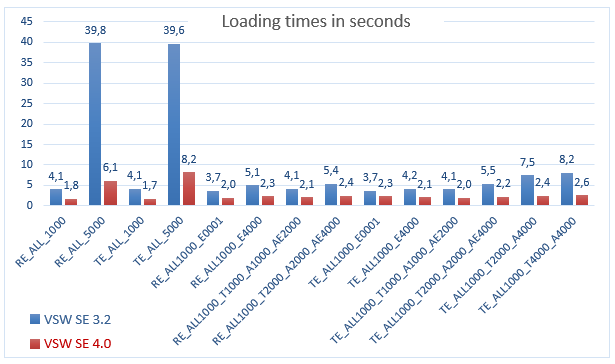
The test cases differ in the number of loaded activities, resources, allocations, allocation entries, and entities. As you can see, we have succeeded in significantly improving the charging performance in all cases. This success encourages us to work on the improvement of performance during user interactions as one of the next steps.
Polish and Portuguese language needed?
So far, VSW SE has already supported most of the languages of the Western world. Now two more important languages have been added: Polish and Portuguese. They can be selected by specifying the locale widget option and then affect the labeling of the timescale.
Internals only, but nevertheless important for you
Last, but not least, we have redesigned a lot of the internal software layers VSW SE is based on. Although this may sound like a “That's none of my business!”, it nevertheless has a big impact on your and our daily experience with VSW SE. This code redesign means:
- better performance of the Gantt charts in your applications
- higher reliability and robustness of VSW SE
- you benefit from the fact that future enhancements of VSW SE will be realized faster.
Finally ...
This was a rough overview of the most important changes in the new version of VSW SE. Of course, it would go beyond the scope of this document to list all the many other new object properties and widget options. Please refer for this the Changelog chapter of the Interface Definition Document, which is also included in the download of the free trial version. Ask for a free trial here - before starting the evaluation of our Visual Scheduiing Widget, one of our experts will give you a short demo for free, so you can quickly start developing the HTML5/JavaScript Gantt chart according to your specific requirements.
Let us now look forward to the further development of VSW SE, which we would like to drive forward together with you. So, stay in touch with us and share your ideas and requirements, but also your criticism.