
This release of our Visual Scheduling Widget (VSW SE) is also about how you can get more visual design options for a Gantt chart. For example, you can now freely design the dateline grids, create patterns for your bars, and many other small things to make your Gantt chart more user-friendly and meaningful. Read here what new features version 5.3 provides and how you can use them.
New link property for markers
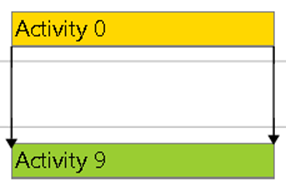
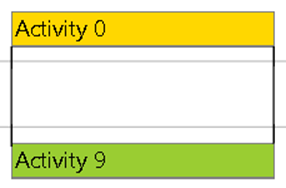
Relationships between activities or between allocations can be visualized by links in the VSW SE. Previously, the links had an arrow at the target bar to emphasize the direction of the relationship.
However, in some cases, these arrows are not desirable. Therefore, the links have now the new property PM_TargetMarker. Setting this property to the value None causes the widget not to draw the arrows.
By the way, you can use this function, for example, to visually emphasize a temporally equal position of two bars. To do this, simply create two links – one of type start-start and the other one of type finish-finish – and then remove the target markers:
More flexibility for the dateline grid
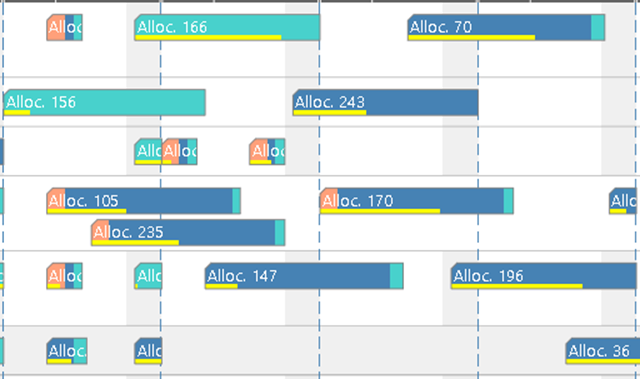
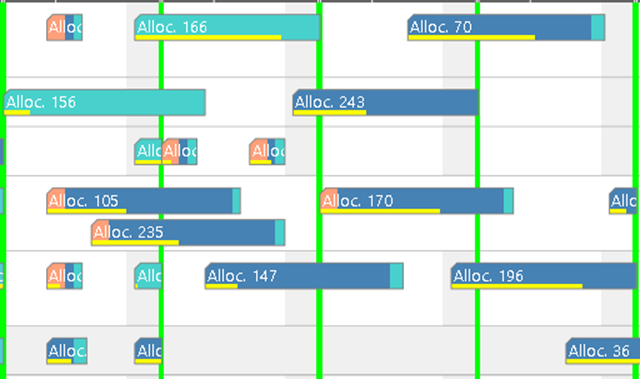
The dateline grid makes it easier for the user to keep orientation about the time periods when looking at the chart. The kind of the grid depends on the value of the dateLineGridMode option. You can choose between a daily, a weekly, or an automatically generated grid. In the latter case, a grid line is drawn for each tick in the timescale.
To allow better customization to the look of your Gantt charts, we have added the pm_dateLineGridColor, pm_dateLineGridDashArray, and pm_dateLineGridWidth properties. With these properties, you can set the color, pattern, and width of the grid lines as needed. The next figures should give you a small impression of what is possible with the new properties:
Scroll to date … nearly
The scrollToDate method allows the application to scroll the time area horizontally so that a specific date is visible at the left edge of the time area view.
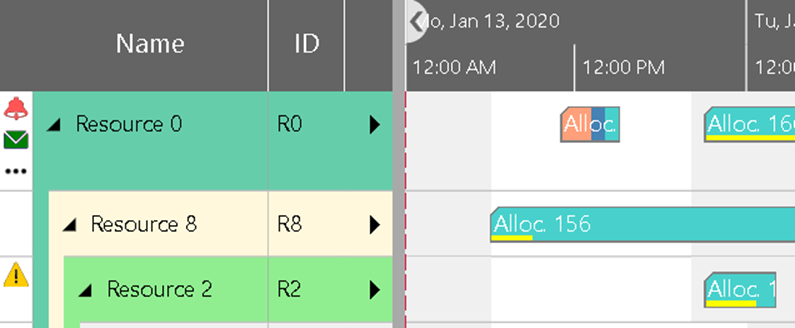
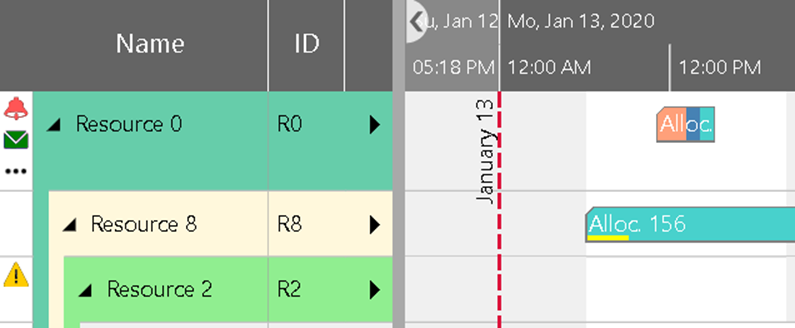
For clarity, it is often useful to have a small margin before the specific date. Then, for instance, a date line marking this date is better to be seen. You can now achieve this with the new offset parameter. Here you have the choice of defining the offset as a number of pixels or as a percentage of the time area view width. The following two figures compare the views after scrolling to January 13 with and without the offset specified:
PDF export: progress and cancellation
The PDF export of the widget is a very popular feature with our customers. Especially those who know our XGantt and JGantt products appreciate the outstanding possibilities to customize the output. The optional division of the chart into several sheets or section markers is just as natural as the repetition of the time scale and table on each sheet.
Nevertheless, there is still potential for improvement, of course. With this in mind, we have on the one hand included the cancelSaveASPDF method, which allows you to cancel PDF generation. Especially if the user accidentally started a PDF generation that would create too many sheets, this method is particularly useful.
On the other hand, there is now a callback function that informs the application about the progress of the generation process. The onSaveAsPDFProgress function is triggered for each page just before its generation process starts. In the argument list, you can find information about the total number of pages that are being created and the number of the page that will be generated currently.
Pattern on bars
One of the most exciting tasks in designing Gantt charts is to make intelligent use of the available graphical features to accommodate the required semantics in the chart. For this purpose, VSW SE offers colors, frames, and symbols for the design of the activity and allocation bars.
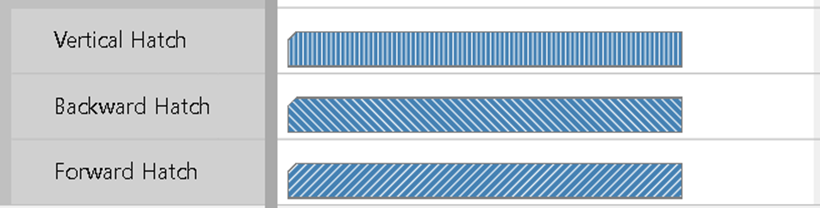
In some cases, this is not enough and that's why we added the properties PM_BarPatternType and PM_BarPatternColor to the activity object. Similarly, for the allocation entries, there are the properties PM_PatternType and PM_PatternColor.
As a pattern type, you can select a vertical, a backward, or a forward hatch:
Symbol column color
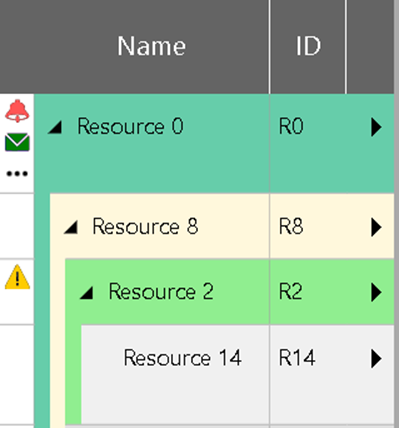
Until now, the background color of the optional symbol column in the Gantt and in the entities table could not be altered. This sometimes prevents a successful integration of the chart into an application taking into account its design. So, we have added the options pm_symbolColumnBackgroundColor and pm_entitiesTableSymbolColumnBackgroundColor. The following figures show an example of how applying this feature can change the look of the table:
Miscellaneous
In addition to the above, there are other small enhancements.
Users of baseline dates will appreciate that the display of the baseline bars can be completely disabled by setting the new option pm_activityBaselineBarsVisible.
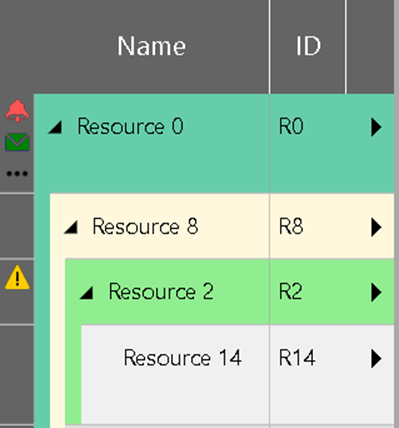
In the Resources View, the PM_CollapseState resource property can be used to specify for each resource row with sub-rows whether it should be displayed collapsed or expanded. So far, this setting also affected the display in the Loads View. That is, a resource was always displayed in both views either collapsed or expanded. Now you can use the new resource property PM_CollapseStateInLoadsView to specify that a different collapse state is applied in the Loads View than in the Resources View.
And finally, there is the new option pm_ignoreCalendarOnActivityBarInteractions. If set to true, the activity calendar will not be taken into account when dragging an activity bar. This means that when the user drags a bar, it can be moved smoothly, regardless of whether the start or end of the bar is in working or non-working time.
Important announcement for users of IE 11
The days of Microsoft Internet Explorer 11 are numbered. Nevertheless, we still support this browser with our current Visual Scheduling Widget. However, as the current modern browsers become more powerful and allow to run modern JavaScript code that is easier and faster to develop than with older versions of JavaScript, we decided not to miss the new possibilities and opportunities. Therefore, we will stop supporting Microsoft Internet Explorer 11 at the end of 2021.
Bug fixes
Bug fixes are summarized in the changelog chapter of the Interface Definition Document.
And what else is there...?
We are very pleased that we were able to win more major ERP software providers as customers this year. If you don't know the Visual Scheduling Widget yet, just test it and convince yourself of the extraordinary functionality of our software 👇
