
We just released version 8.0 of our Visual Scheduling Widget Standard Edition (short: VSW SE) for HTML5 Gantt charts. With this major release, besides others, you get extraordinary new link functionalities, a new mode to sort activity and resource rows depending on their start or end date, and an extended Activities View to give you a deeper insight into the overall allocation of a resource. Read what's new in version 8.0 here.
Breaking change for AMD users
If your application uses Asynchronous Module Definition (AMD) (e.g., by using Require.js), then the dependency for the library D3.js is now refined to request only some specific sub-libraries (see chapter “System Requirements” in the Interface Definition Document (IDD for short) of VSW SE).
jQuery and jQuery UI no longer needed
Originally, VSW SE was designed and implemented as a jQuery UI widget. The reason to use jQuery UI (and therefore also jQuery, of course) was that on the one hand, it compensated incompatibilities between different browsers. On the other hand, it provided more convenience in JavaScript programming. Due to the advancements in both browsers and JavaScript, these reasons are no longer relevant. That's why we decided to completely abandon jQuery and jQuery UI without sacrificing compatibility. This reduces the download requirements of your application by approximately 400 KB.
What does this mean for you as a developer? You now have the option to use VSW SE either in the traditional way (i.e., as a jQuery UI widget) or alternatively as a widget without jQuery. Whichever way you choose, the API remains the same except for the widget creation. The instantiation changes slightly. Instead of
vsWidgetInstance = $(vsWidgetDivElement)>.nVSWidget(options).nVSWidget("instance");
the new way of instantiating VSW is as follows:
vsWidgetInstance = new netronic.nVSW.VSWidget(vsWidgetDivElement, options);
From now on, you can use the widget instance object in the same way as before. But your application is freed from having to include jQuery and jQuery UI.
One additional hint: If you use the plug-in jquery-ui-contextmenu in your application to show context menus, you can switch to the plug-in d3-context-menu. To assist you this is implemented in the Sample Application that is delivered with VSW SE.
Extensions to links
Perhaps the most important extension to the link object are link entries. Links visualize dependencies between two activities or allocations. They make it possible to express the semantics that, for example, activity B cannot be started until activity A has been completed.
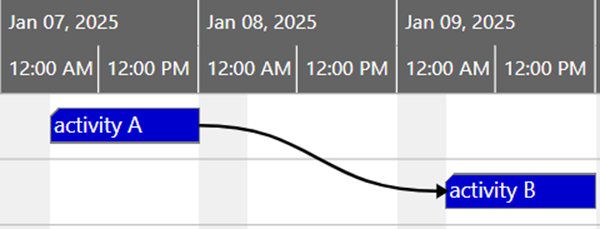
In practice, a certain amount of time may elapse between the end of activity A and the start of activity B for various reasons. For example, the items that were processed during activity A must be transported to another resource for further processing. Or the items have to dry for a certain period of time before the next operation can start. Of course, the time waiting time for the availability of a resource can also influence the time interval between two activities.
Link entries allow you to visually divide the links into sections to highlight such special times. For each entry, you can specify a duration and a color. In the following illustration, for instance, you can see the red line section, which in this case represents the required transportation time.
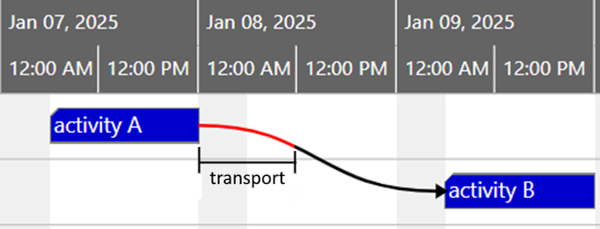
It is also possible to have more than one entry per link.
Another great option in the context of links is linksWithDanglingStartOrEndVisible. When rows are collapsed or visibility filters are used, it can happen that either the source or target element (an activity or an allocation) of a link is hidden. In such a situation, the link was previously not displayed at all.
Now you can set the linksWithDanglingStartOrEndVisible option to true and the hidden element will be represented by a little circle. This way, the user is made aware of the existence of the link even though one of its connection points is missing temporarily.
The following animation shows the effect of this option when Activity 2 is hidden by using a visibility filter:
As you can see, the horizontal positions of the circles correspond exactly to the respective connection points on the bars. In the vertical direction, they are positioned in the hidden row.
To make life easier, the new defaultLinkTargetMarker option can be applied to globally define the appearance of the target marker of the links. Of course, you can overwrite this value for each link individually by setting the TargetMarker property of the link.
Extension of the Activities View
The Activities View and the Resources View are, strictly speaking, two sides of the same coin. To bring both sides closer together, it has been possible for some time to display allocations (i.e., elements from the Resources View) in the Activities View as well. The following figure shows an example of such a view:
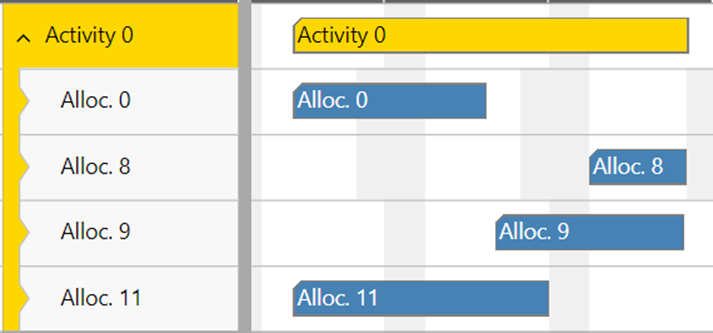
Now, it is also possible to group the allocations according to the resources to which they refer by using the new resourcesVisibleInActivitiesView option:
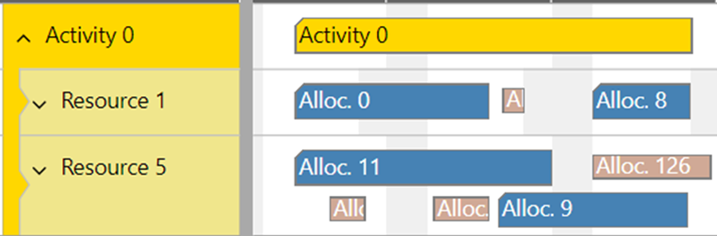
As you can see, this way of displaying has the advantage that now all allocations relating to a resource are displayed and not just those associated with the activity. The pale bars represent allocations that relate to other activities, while the blue bars represent allocations for the activity currently under consideration. The design of the first ones can be customized by the application.
There are a lot of further API extensions that empower you to customize the allocations and the resource rows in the activities view. For more details, please see in the IDD the descriptions for
- option allocationBarDesignOfOtherActivity,
- option defaultAllocationAllowedRowDragModesInActivitiesView,
- option defaultResourceTableRowDefinitionIDInActivitiesView,
- method setResourcePropertiesForActivities, and
- resource property AllocationRowsCollapseStateInActivitiesView
New sorting mode for activity and allocation rows
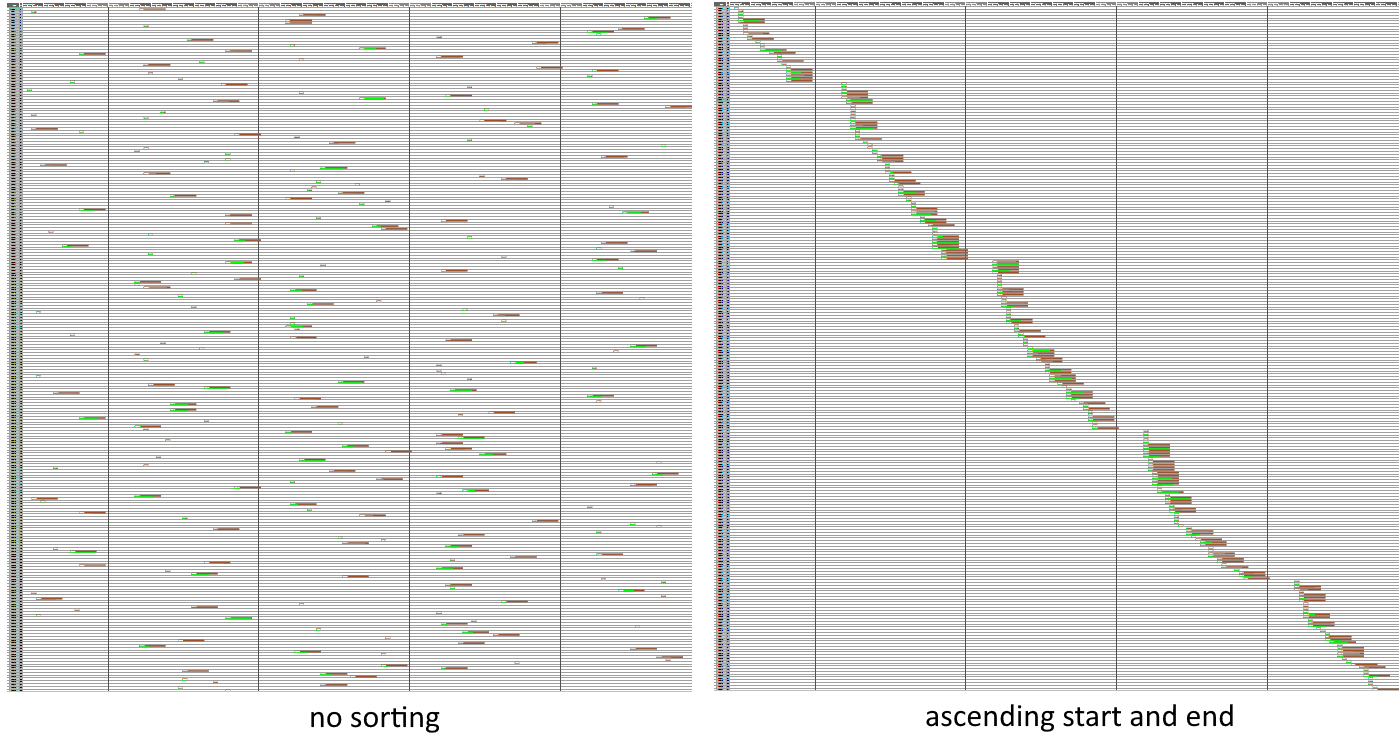
Previously, it was possible to specify the sorting of activity or allocation rows using a sort code. Now, activity as well as allocation rows can be sorted depending on their start and end dates. See the new value AscendingStartAndEnd for the options activityRowSortMode and allocationRowSortMode. The following illustration should give you an idea of the effect of this type of sorting. On the left-hand side, you can see an unsorted diagram and on the right-hand side, you can see the same data in a chronologically sorted order.
Enhancements to skills
Skill objects can now show allocation bars when the resources are collapsed. For this, use either the new CollapsedRowDesign property for skill objects or the defaultSkillCollapsedRowDesign option to define it globally.
Another improvement to skills is the AllowedRowDragModes property. This allows skill rows to be moved interactively in the same way as resource rows.
Smart dragging of bars
The new bar drag mode called DragSmartHorOrVer works similarly to the DragAutoHorOrVer mode. However, the user can now change the direction while dragging by simply moving the cursor in the other direction. Thus, for example, he can first select a new row for a bar and then a new time range, both in the same drag interaction. In contrast to free dragging (DragHor and DragVer flags are both set), the bar is dragged as smoothly as on rails.
Miscellaneous
There are a lot of other minor changes in this release such as the new options
- tableColumnSeparatorColor
- entitiesTableColumnSeparatorColor
- finishedAllocationBarsShownUnstackedInBackground
Please read the chapter “Changes” in the IDD for further details.
In this context, it should not go unmentioned that it was time to restructure the IDD since the API of VSW SE has grown continuously in recent years. The focus of this improvement was mainly to give the user the possibility to navigate through the documentation very easily. This was achieved through the significantly greater usage of internal hyperlinks.

Features in previous releases