
With planning boards, you often need a quick overview of jobs, tasks or resources. It helps to sort the entries in the table part. In the past releases of our Visual Scheduling Widget (short VSW SE), we have already introduced the strong re-sorting function via drag&drop. Now we have worked further on this topic. Check out what's new in version 6.4 of our HTML5/JavaScript Gantt widget.
Extended support for sorting the table
The ability to process sort codes for ordering the table rows is a strong feature of VSW SE, especially in conjunction with interactive row drag & drop. Now there is another way to sort rows interactively. If you set the new option interactiveSwitchingOfSortOrderEnabled to true, the user can re-sort the rows by clicking or tapping on a cell in the table title.
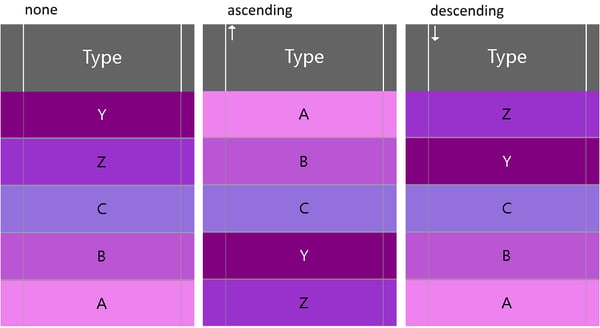
With each click, the sorting mode changes and the rows are sorted according to the values of the cells in the respective column. There are three sorting modes: none, ascending, and descending, which are traversed in a cyclic order:
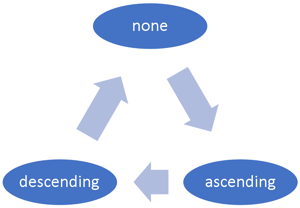
If the unsorted order is not desired, then the sorting mode none can be skipped by the option rowSortModeNoneEnabledOnInteractiveSwitchingOfSortOrder.
To inform the application about the user’s interaction, the callback onRowSortingChangeRequested will be triggered each time the user clicks or taps on a table title cell. This gives the application the opportunity to react to the interaction, such as updating the business logic data or even canceling the requested change.
To visualize the current mode, the option sortingIndicatorVisible must be set to true. A small icon in the title cell indicates whether the rows are sorted by the values in the associated column, and if so, whether they are sorted up or down:
Asynchronous rendering for improved user experience
Depending on various parameters, such as the number of rows, the size of the time range to be displayed, the complexity of the bar design, etc., the user may find it annoying to interact with the chart as the number of data grows. In particular, vertical scrolling or zooming in and out of the time area may respond only slowly.
To improve the user experience by making the VSW SE more responsive, the two new options asynchronousRendering and asynchronousInteractiveTimeAreaStretching have been added to speed up the visualization by asynchronous processing.
In both cases, the chart will draw the content of the time area only, when there is enough time to draw the bars, but at the latest when the user has finished the interaction. If there is a delay in drawing details, the VSW SE shows only a rough sketch of the bars (only when asynchronousInteractiveTimeAreaStretching has been set) and a stripey background to alert the user that the drawing is not yet complete.
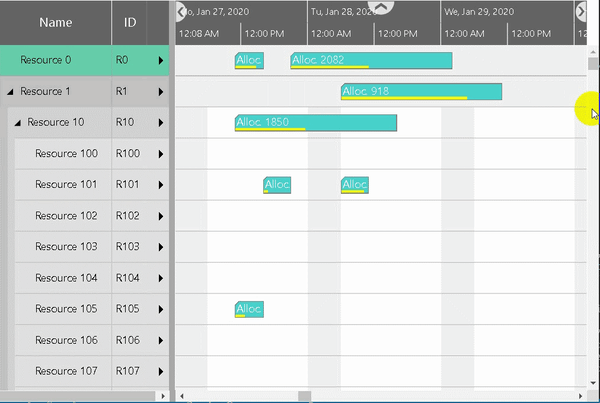 Figure: asynchronous rendering when scrolling vertically
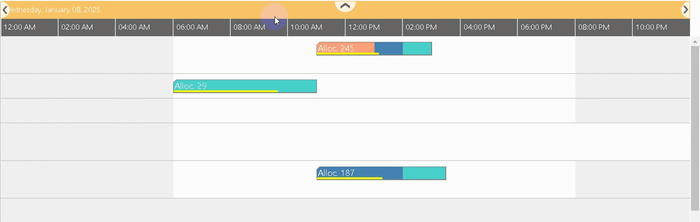 Figure: asynchronous interactive time area stretching
Context menu on the timescale
Regarding the possibility to let context menus appear, the timescale was still a blank spot. Now the callback onShowContextMenu is also triggered when the user clicks the secondary button of the mouse or presses the finger on the timescale.
Enhancements to the tooltips
Since it has been possible for some time to explicitly define links not only between activities but also between allocations, we have extended the TooltipTemplate object by the additional keywords >SourceAllocation and >TargetAllocation.
Activity and allocation bars can be provided with tooltips. So far, the onShowTooltip callback was triggered for a bar only once when entering the bar area with the cursor. Since both activities and allocations can have multiple entries, more precise information about which entry is currently under the cursor has been missing. With the new option triggeringOfOnShowTooltipForEntriesInBarsEnabled this gap is now closed. If it is set to true, the callback is triggered every time the cursor enters another entry. For instance, if the cursor enters a bar containing three entries and is moved across all entries, then the callback will be triggered three times. And each time the index of the hit entry is passed as a callback argument.
More flexibility in the calculation of common non-working time
The ability to suppress non-working times in the chart is a powerful feature to focus on what is really of interest. VSW SE regards for this purpose the calendars of all rows in the chart and calculates those non-working time ranges that are common to all calendars. These ranges can then be hidden.
However, this approach turns out to be disadvantageous as soon as additional calendars are taken into account, or calendars are to be ignored. For example, let's say we haven't loaded all the resources into the resource view yet (keyword "lazy loading"), but we want to hide the non-working times, also considering the calendars of the resources that will be loaded later.
An analogous problem occurs when certain calendars are to be ignored. This could be the case, for example, if you have a machine that is available 24/7. The calendar of such a resource would prevent non-working times from collapsing at all.
In both cases, the new option nonWorkingTimesCalendarIDs helps to solve these problems. This option allows you to specify which calendars should be included in the calculation.
Extended object identification for drag & drop
User interaction with a VSW SE diagram on a web page needs not to be limited to interaction within the diagram itself. Sometimes it is also desired to drag objects from outside the diagram and drop them on the diagram. In this case, it may be of interest to identify where the object was dropped.
This is exactly what the method determineObjectByPageCoordinates is intended for. Passing page coordinates to it, the method returns all information about the target object within VSW SE, in a similar way as the callbacks onShowTooltip or onShowContextMenu do.
Redesign of the feature sample in the Sample App
So far, the feature sample that is part of the Sample App shipped with VSW SE has consisted only of an incomplete and disorganized collection of rows and bars. For the users, it was a challenge to exactly the feature found in this mess that was best suited to implement the requirements for their application.
Furthermore, there was no hint at all on how to address or use the features shown in an application. For this, a tedious search through the JavaScript code of the example was required.
Now we have redesigned this example and covered most of the features. We have grouped the features thematically to make the search easier.
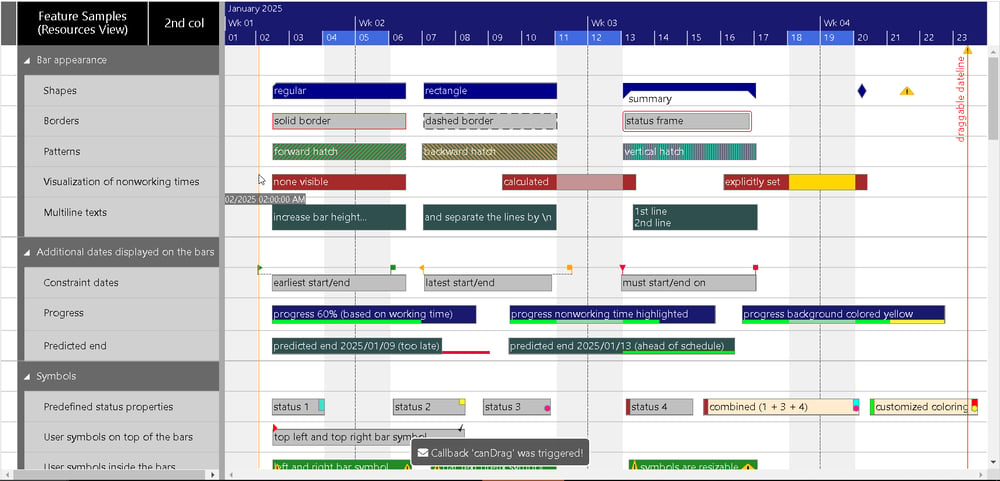
Furthermore, the example has been enriched with tooltips that show how to access or use each feature.
Next step
Those who do not yet have the VSW SE in use are welcome to test it free of charge for 30 days.
