
Looking for ideas on how to intelligently design graphical planning boards? In my blog series about our Visual Scheduling Add-In Developer Toolbox I not only describe the development background of this product, but also how we use it for our own planning boards for Microsoft Dynamics 365 Business Central. In this article you can have a look at functions that we use on a planning board for production scheduling.
Interview with Sascha, our CTO, about functions in the VPS realized by the toolbox
I already heard from Frank that the development of the 2.0 version of the Visual Job Scheduler (VJS) went very fast thanks to the toolbox. Was that also the case when your team was working on the migration from Windows only Visual Production Scheduler (VPS) to the new Web Client VPS for Business Central?
Sascha: Yes, with the help of the toolbox that we initially had built for our in-house development, we were able to quickly transfer the visualization requirements from the "old" VPS to the "new VPS". So VPS and VJS could also be released practically simultaneously in AppSource.
Are all functions of the Windows only VPS now transferred to the Web Client VPS?
Sascha: Almost all functions are already in the new version but we are successively implementing the missing functionality and adding new functions. The last thing is worth mentioning: the toolbox actually opens up some possibilities that we didn't have before.
As Frank told me, have you also learned from customer feedback and added new functionality?
Sascha: Of course! For example, we have added work center groups to the visualization. Previously there were work centers and machine centers, but because Business Central also works with work center groups, the VPS now also displays them.
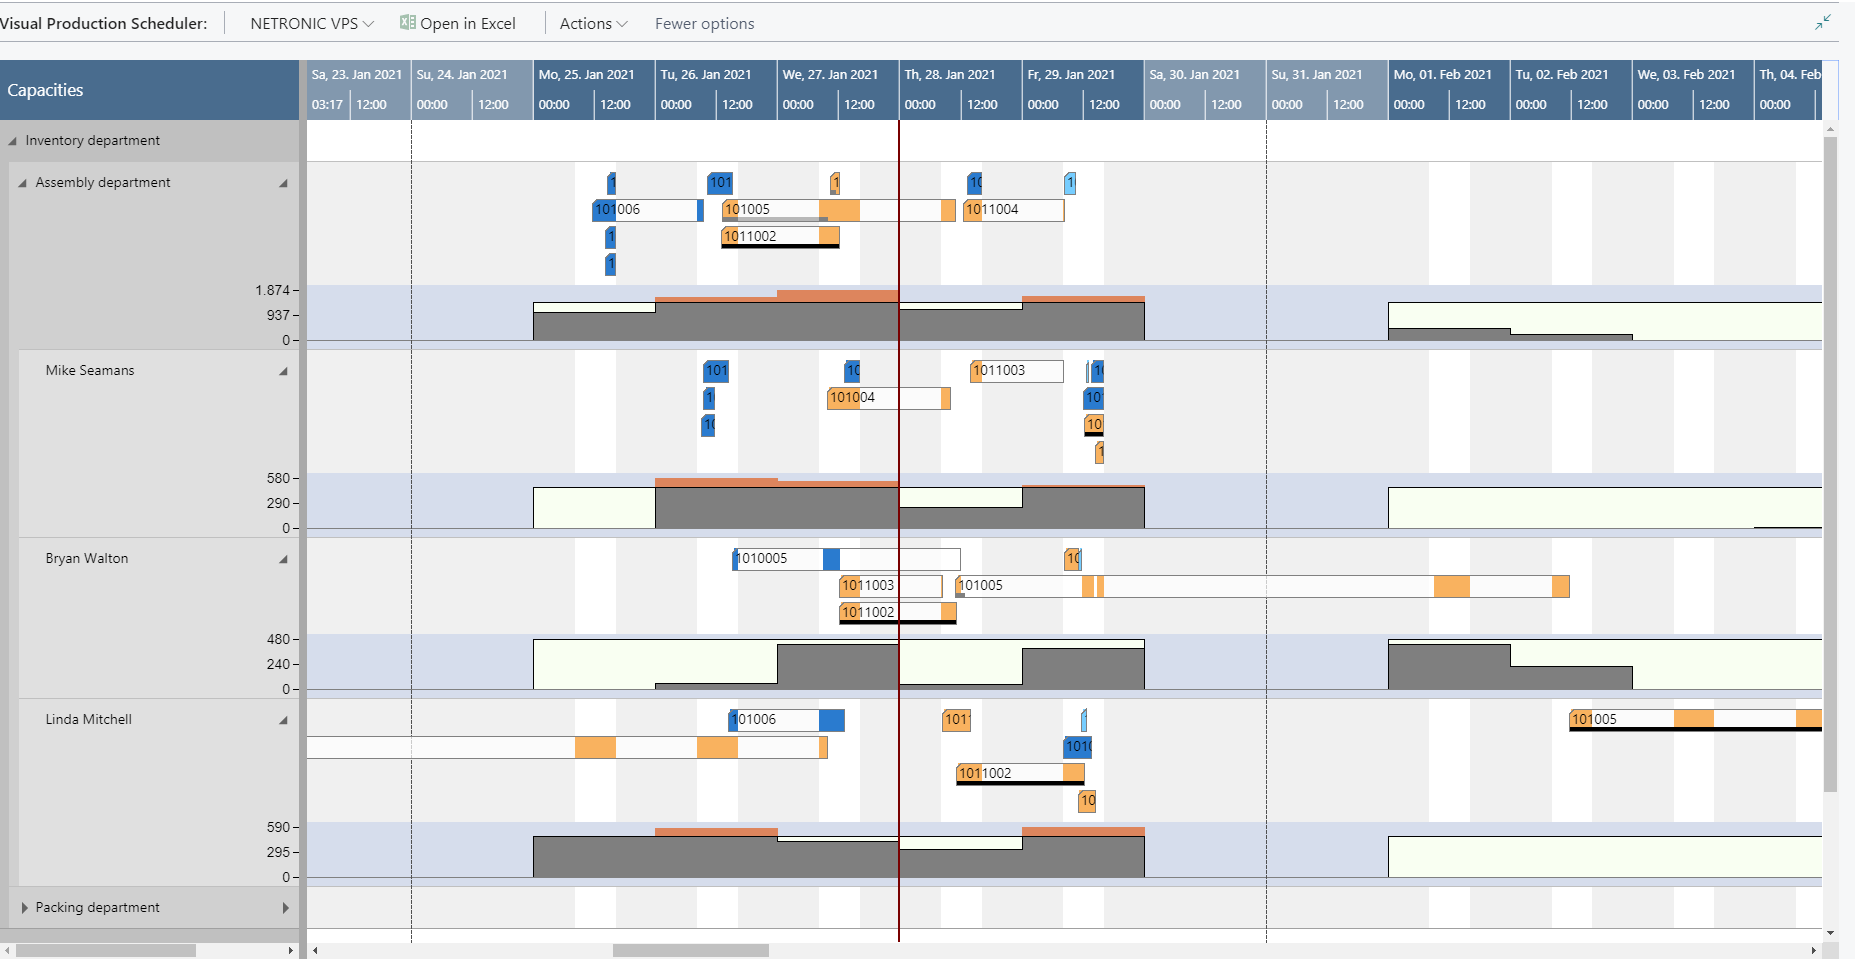
Another major change compared to the "Windows only VPS" is displaying the capacity in the resource view. Up to now, the capacity was shown below the Gantt chart area. We now visualize the capacity directly below the resource so that the planner immediately grasps the connection between resource, occupancy and capacity.
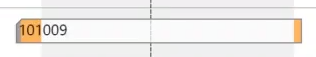
A very nice new feature is the visualization of the setup times at the machines. Everyone knows this from production: with many production processes, the machines must first be set up before actual production can begin. This information is only available in the tooltip of the "Windows only VPS", but it was a feature that many customers also wanted to see on the bar itself. Now the setup time is visualized by a grey section at the beginning of the bar.
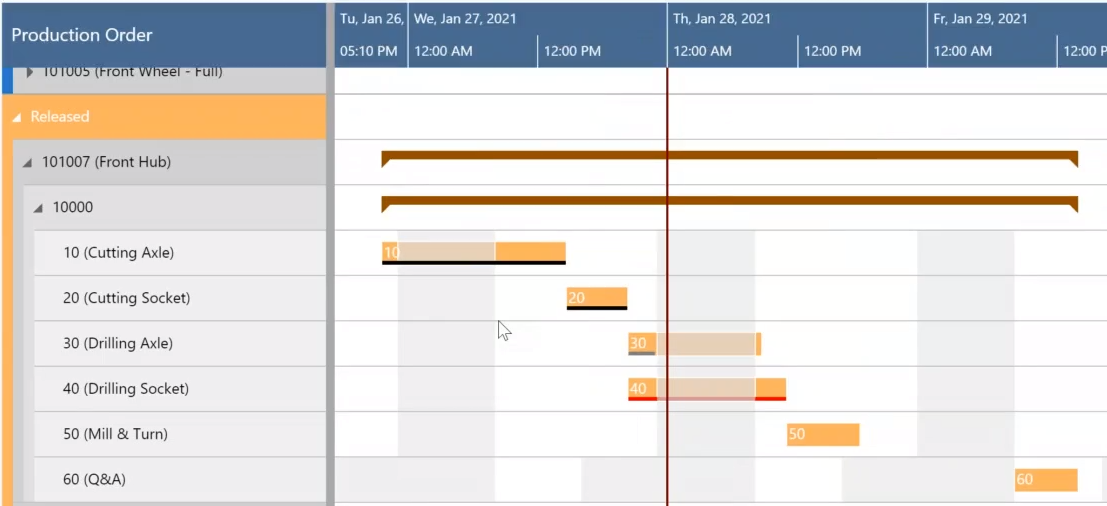
We also revised the visualization of the progress bars. Even before that, you could display the progress, measured either by quantity or time. Now, we offer a three-step visualization.
A grey bar below the operation indicates that the operation is still in progress and shows the amount of the progress according to its length.
A red bar below the operation indicates that already more quantity/time than originally planned has been consumed. The amount of the exceed can be gathered from the tooltip.
A black continuous bar below the operation shows that the operation is finished.
What steps are planned next for the VPS?
Sascha: We can't say for sure what feature we will add in 6 months. What I can say for sure is what feature we will add in one month, as we work with a monthly release cycle. The features we choose reflect our customers' feedback, because at the end we do not want to make the Web client VPS the same as the Windows only VPS, but to make it even better.
This is the reason why I like the concept of the toolbox so much. We do not have a fixed set of features but we can add proven features to the toolbox as needed any time.
Many good ideas for developers who want to create an intelligent planning board with our toolbox. Thanks a lot, Sascha.
Now you want to try to create a planning board for your Microsoft Dynamics 365 Business Central scheduling solution? Download your free trial version here:

More about "The story behind":
#1 Interview with Martin about how did NETRONIC come up with the idea
#2 Interview with Dieter about what the structure of the tool box looks like
#4 Interview with Martin on the first step into the Dynamics NAV world
#5 Interview with Frank about how he enhanced the functionality of the VJS with the toolbox