
When you have read the previous 4 blog posts you know that the Visual Scheduling Add-In Developer Toolbox is a unique tool that supports AL developers in creating planning boards in HTML5/JavaScript. Since we "eat our own dog food", we also use the toolbox for our own Visual Scheduling Suite. So I interviewed Frank Köhnen, the product developer of our Visual Jobs Scheduler, and asked him how he uses the toolbox. He shares his experiences here and gives some nice visualization tips.

Interview with our VJS product developer on how he enhances the functionality of the VJS with the toolbox
You have developed the .NET version of the Visual Jobs Scheduler and are now responsible for the development of the Business Central web client version. In my view the new product has been developed quite rapidly. How did that come about?
Frank: The implementation went really fast. This was because last year we have developed a toolbox for visualization for our own use and now are able to use this one tool for all products. Since we also offer this toolbox to ISVs who want to develop a suitable planning board for their industry solutions on their own, they already know this toolbox as "Visual Scheduling Add-in Developer Toolbox".
Did you change the visualization or functionality as compared to the "old" VJS?
Frank: Yes, of course we learned from the feedback of the end users and partners and took it into account for the development of the new product.
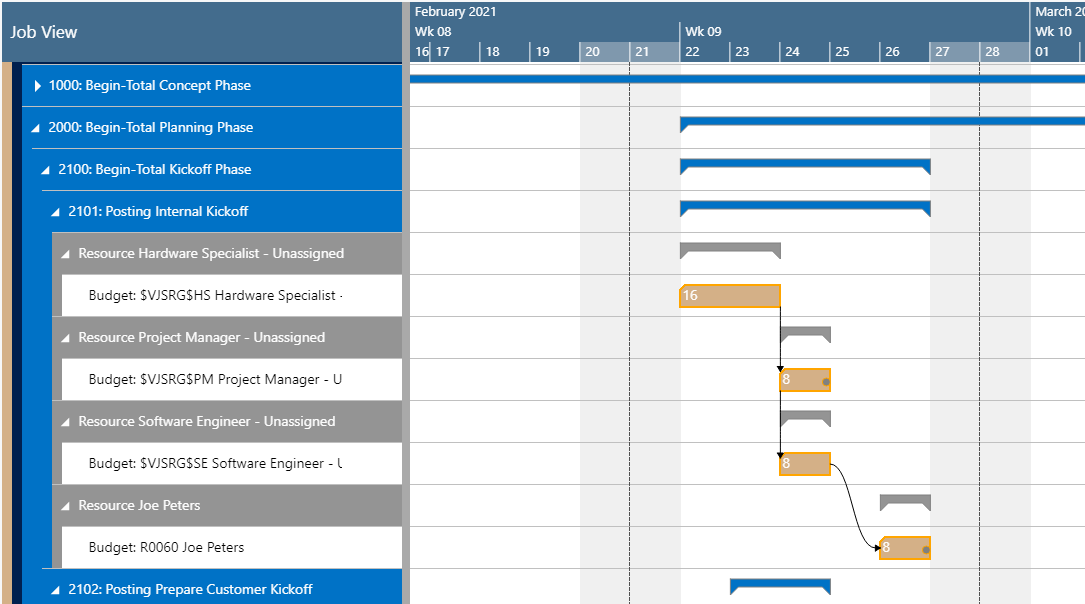
For example, planners want to see which bars they had moved before writing the data back to NAV via Save. In the Windows only VJS, the moved bar gets a red border. However, red is actually a warning color - it warns the planner of an error. So we looked for another marker: now in the Web Client VJS, after moving, a small gray dot appears on the right side of the bar as an indicator for a manually rescheduled resource or task.

Another example: If a user of the Windows Only VJS selects a bar, the bar is marked with a thin orange border. The operations associated with it are also marked with the same organe border. For the Web Client VJS we implemented different border thicknesses: thick orange border for one selected bar and thin orange border for other tasks associated with this task.
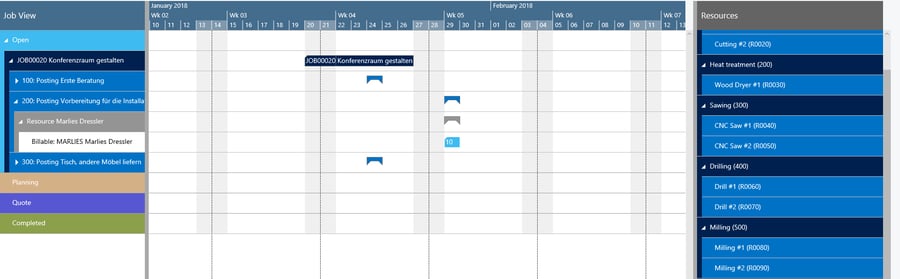
The link design also changed. Now the links are much rounder and hence better visualize the "flow" of activities. In addition, we also added another function to it: they now visualize start-start relations as well as end-start relations.
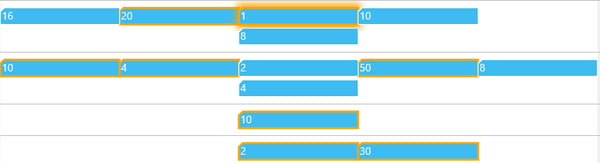
And there is also a completely new function in VJS 2.0: the creation mode. If this mode is switched on, a table appears to the right of the diagram part, which shows the orders in the resource view and the resources in the jobs view. Using this table, the planner can manually assign tasks to resources or resource to tasks from the project. We have implemented this feature because project managers often have to book additonal resources as support for a task that threatens to run late. In the Windows Only VJS, this problem was solved by splitting a job planning line and then moving it to another resource, but the creation mode offers a much more elegant and clearer way.
Is this additional table feature part of the Developer Toolbox?
Frank: Yes. And I think it is also very helpful for any other planning or dispatching solution. The table can be used for so many different tasks. For example you can implement not to visualize all resources in the table, but only the resources with the skills needed for this task. Or you can visualize the different states in the table by e.g symbols: open, planning, quote. If the planner gets the information about a changed status of the job, like a job quote has been accepted by a customer, he can drag the symbol with the now valid status (here planning) from the table on the right to the order and change the status this way interactively.
In general, developers should remember this rule of thumb : whatever you see in our Business Central Visual Scheduling Suite can get achieved with the toolbox!
What are the next steps planned for the VJS?
Our plan for the next months is to bring the Web client VJS to the same feature set as the Windows only VJS since in the current version not all functions are included yet.
I want to just use more functions of the toolbox :-)
So you use the toolbox to make the VJS even more intuitive and intelligent. Thanks for the interview, Frank.
More about "The story behind":
#1 Interview with Martin about how did NETRONIC come up with the idea
#2 Interview with Dieter about what the structure of the tool box looks like
#4 Interview with Martin on the first step into the Dynamics NAV world
#6 Interview with Sascha on some features he realized with the toolbox in the VPS