The new version 1.4 of the Visual Jobs Scheduler, our add-in for visual project planning in Dynamics NAV, has been released. The interactive planning board for visualizing jobs, job planning lines, job tasks, resources and resource allocations was enhanced by some really powerful features which at first glance might not look really that important, but believe me, there is a whole lot more to them. Describing all new features in their full depths would go way beyond one blog post so that today I will briefly introduce the new features and give you comprehensive descriptions of some selected features in posts to come (and a webinar that we'll host on Dec 4, 2017).
Before digging into all details, you just should know that here you can find the release notes for the Visual Jobs Scheduler.
Notes
Extending the Notes feature you already know from Microsoft Dynamics NAV, we have added the option to create and view notes in the VJS and, moreover, not only on the Jobs level but also for Job Tasks and Job Planning Lines. Creating nodes can best be done via the context menu on the desired level, or, if there are already existing notes, by clicking the symbol.
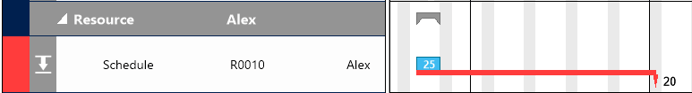
Milestones
If you want to display milestones, you can modify the data interface accordingly. The following cases can be illlustrated by milestones:
- No discrepancies (grey)
- The actual start date is later than the milestone Start (red)
- The actual end date is later than the milestone End (red)
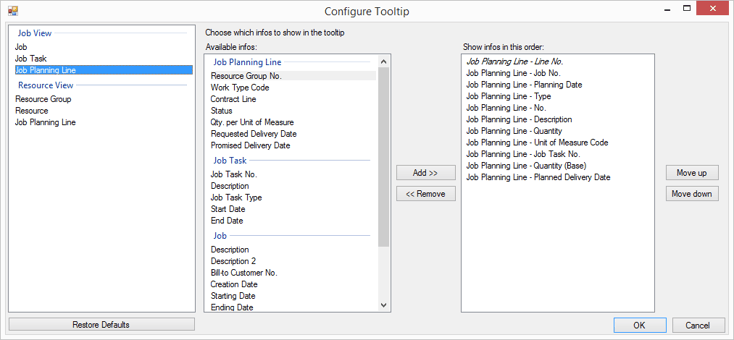
Tooltip
The tooltip was enhanced by the fields of the respective higher level(s).
Allocations
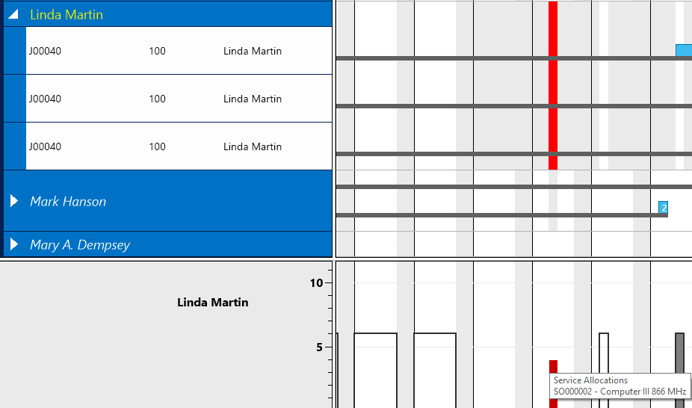
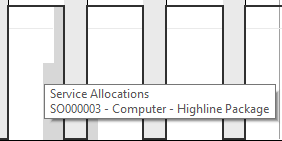
Allocations of the modules Service and Assembly and of Jobs that are not currently loaded into the VJS (e.g. due to filter settings), that cause an overload at the corresponding resource, are indicated in red. In the Resource View, the histogram's tooltip informs you which module/job is blocking the resource.
Allocations that don't cause overloads are represented by a pale grey capacity curve.
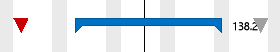
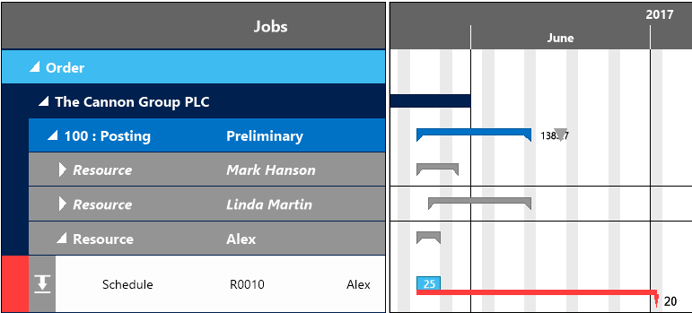
Posting date and quantity
Posting date and quantity are now shown for each Job Planning Line. Discrepancies, like a posting date being later than the planned start, or posted quantity being lesser than the planned one, will be indicated by according symbols/colors.
In the picture shown below, the posting date is indeed later than the planned start (red line and red flag in the table row) and the posted quantity is lesser than the planned one (downward pointing arrow next to the flag).
If there are no discrepancies, the line between posting date and Project Planning Line will be grey.
|
By clicking the according new icons, you can hide or show the postings. |
Posting Problems View
This new view is in fact a collapsed Job View that only shows posting problems like described above. We have added a new icon ![]() to comfortably switch to this View.
to comfortably switch to this View.
Create Time Filter Buttons
The partner can create buttons for the menu ribbon that allow to modify the timescale of the VJS and at the same time to limit the number of displayed bars. This is done by modifications of the CA/L code and applies to the functions
-
- DayView
- WeekView
- MonthView
- FilterToShownTimespan
These buttons work like filters.
|
A button was created for the DayView function. |
Start the VJS in the Resource View
By modifications of the CA/L code the partner can specify that the VJS will be started in the Resource View.
More information
- Webinar about selected features of the VJS and the VPS.
- Some best practice wanted? Read about rough and fine planning jobs in the Visual Jobs Scheduler.
- More information about Visual Scheduling for Microsoft Dynamics NAV is available in this ebook: