
Today we released a new version of our Visual Scheduling Add-in Developer Toolbox (VSADT). With the VSADT you can very easily develop individual, interactive graphical planning boards for Microsoft Dynamics D365 BC, only by using AL respectively CAL code. Read, what's new in version 6.0.
Grouping rows within the Gantt chart table
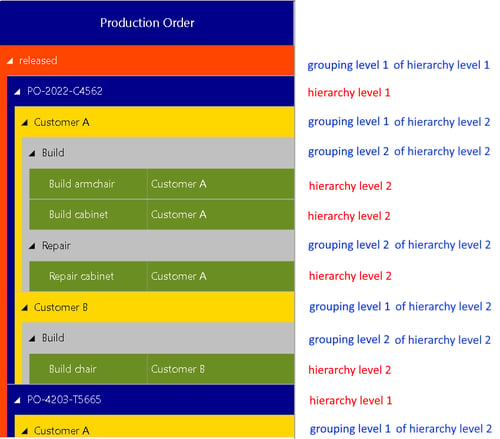
In order to structure the data in the Gantt chart, the VSDAT has so far offered the possibility to build hierarchies. The items that are displayed in the table part, i.e., activities, resources, and entities, each have the ParentID property for this purpose.
This approach lacks flexibility because it assumes that each item has been explicitly specified for each level. And when creating or changing the structure, you as a developer must ensure that the ParentID property is always set correctly.
For this reason, we extended VSADT with a grouping mechanism. This allows you to group the rows of each hierarchy level depending on several freely selectable criteria.
Please note that the extended grouping mechanism is only available in the AL version of the VSADT, not in the CAL version!
More options for a compact layout of the Gantt chart
So far, it is possible to generate some kind of compact layout by using certain toolbox settings. More details can be found in the source code of the sample application that is shipped with VSADT.
To achieve an even more compact layout, the following settings have been added:
- PM_ActivityBarTopOffsetAndHeightScaleFactor and PM_AllocationBarTopOffsetAndHeightScaleFactor – to downsize the bars by a factor.
- PM_EntitiesTableCellContentTopOffset and PM_TableCellContentTopOffset – to diminish the offset of the table cell content.
- PM_EntitiesTableTitleHeight and PM_TableTitleAndTimescaleHeight – to reduce the height of both the table title and the timescale.
- PM_ProgressBarHeight – to reduce the height of the progress bar within the activity and allocation bars.
Tree view style for structure visualization in the tables
Certainly, the biggest enhancement for the design of the Gantt and the Entities table is a new ability to visually style the tree-like structure of hierarchies and groupings. Until now, the affiliation of a table row to a certain structure level was visually indicated by a colored indentation (as shown above).
The new setting TreeVisualisationMode allows switching to a different appearance, where lines instead of colored indentations visualize the tree structure.
The following figure compares three different looks. First, you see the “classic” look with the colored indentations, then the new tree view style is shown. And last but not least, since you can color the tree lines as you like (see options PM_TreeViewLineColor and PM_EntitiesTableTreeViewLineColor), they disappear when the color is set to “transparent”.
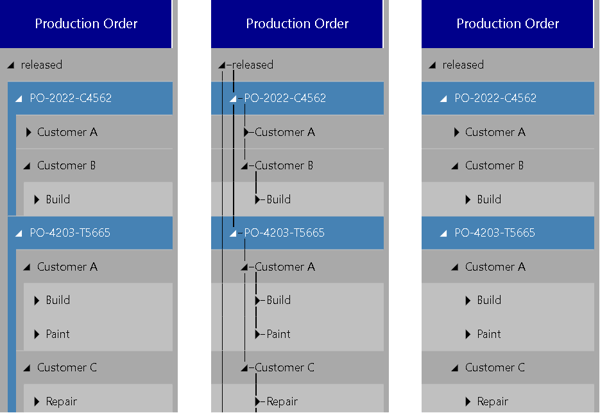
Besides the color, you can also customize the stroke of the lines by defining a dash array (see options PM_TreeViewLineDashArray and PM_EntitiesTableTreeViewLineDashArray).
Using your own symbols for bars instead of the predefined shapes
The new activity and allocation bar shape Symbol opens up completely new possibilities for designing the bars. The PM_BarShapeSymbolID property of the activity or allocation objects allows using a custom symbol instead of one of the predefined bar shapes.
Enhancements to the symbol column
The symbol column, which can be displayed at the beginning of the Gantt and the Entities table, is intended to draw the user's attention to specific rows by presenting symbols.
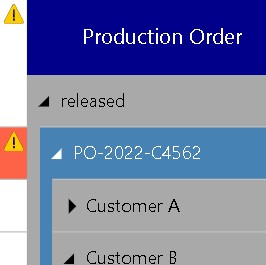
The first enhancement to the symbol column improves the options you have to achieve this goal. Besides adding symbols to it, you can now also color the background of each cell within the symbol column. For this purpose, the property PM_RowSymbolColumnBackgroundColor has been added to activities, resources, and entities, which allows marking every single row. Another option is to define a color by the new table row definition property SymbolColumnBackgroundColor.
In this case, all symbol column cells that belong to a row to which the table row definition is applied are colored. The following figure illustrates how the new options might affect the appearance:
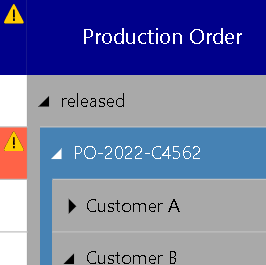
The second enhancement concerns the background of the symbol column title. The new settings PM_SymbolColumnTitleBackgroundColor and PM_EntitiesTableSymbolColumnTitleBackgroundColor are for customizing the color of title cell. For instance, if we set the color to the same value as for the regular table title, then it will look like that:
Temporarily highlighting objects
When using the ScrollToObject method, you are used to seeing a blinking frame that highlights the desired object. It is precisely this graphical effect that can now be applied to temporarily highlight object without using the ScrollToObject method. To do so, use the new HighlightObjects method.
As you can see in the next two figures, multiple objects can be highlighted at the same time. The only restriction is, that they must be of the same type. That is, you can highlight either activities, resources, allocations, links, or entities:
Temporarily highlighting in this context means, that it will stop as soon as another call of HiglightObjects is executed, or the user is interacting with the Gantt chart in any way.
The predefined color of the flashing frame can be changed by the PM_ObjectHighlightingColor option.
As part of this enhancement, the settings PM_ScrollToObjectHighlightingColor and PM_ScrollToObjectHighlightFlashingEnabled have been renamed to PM_ObjectHighlightingColor and PM_ObjectHighlightFlashingEnabled, respectively.
Miscellaneous
There are a lot of other useful extensions that can help you add more value to your application:
- In addition to coloring, you can now apply a stroke pattern to the curve lines. For this, the PM_StrokeDashArray property has been added to the Curve objects.
- Previously, the OnClicked and OnDoubleClicked events were not triggered if the user had clicked or double-clicked in an empty range within the time area. Now, both event functions are also called as soon as the new PM_ClickEventTriggeringOnRowInTimeArea setting is set to true.
- The new PM_DragDatesShownForSingleSelectedObject setting, when set to true, ensures that the dates limiting drag interactions are displayed not only during the interaction but even when only a single activity or allocation bar is selected.
- When the optimized mode of the row design is enabled, VSADT ensures that the bars do not overlap by shifting them vertically with respect to each other. The new option PM_BarSortModeForOptimizedRowDesign gives control over how the toolbox sorts these bars, i.e., how they are ordered.

Further readings