As you already know, the new version 1.4 of the Visual Jobs Scheduler, our add-in for visual project planning in Dynamics NAV, that has been released in November, has a lot of new mighty features to show. In my last post, you learned how to best use the new time filter options. Today I'd like to show you how you can avoid multiple resource allocations.
Same resource table for different modules
Since the NAV resource allocation table is not only used by the Jobs module but also by the Service and the Assembly module, it could easily come to double allocations if, e.g., the resource Linda, is already assigned by the Service module and at the same time is needed for the Jobs module. To avoid those double resource allocations and to gain more control of resource utilization with Dynamics NAV, the VJS now visualizes the resource allocations of the Service and the Assembly m,odule and also of jobs that are not currently loaded into the VJS (e.g. due to filter settings).
Visualization of resource utilization so far
Up to now, resource utilizations were indicated in the VJS's histogram area and in the histogram view by dark grey columns or red ones in case of an overload.

Visualization of resource utilization now
The VJS now offers new ways of indicating allocations coming either from the two other modules or jobs that are not currently loaded into the VJS. This way, the planner always knows whether a resource can be used or not and to which extent.
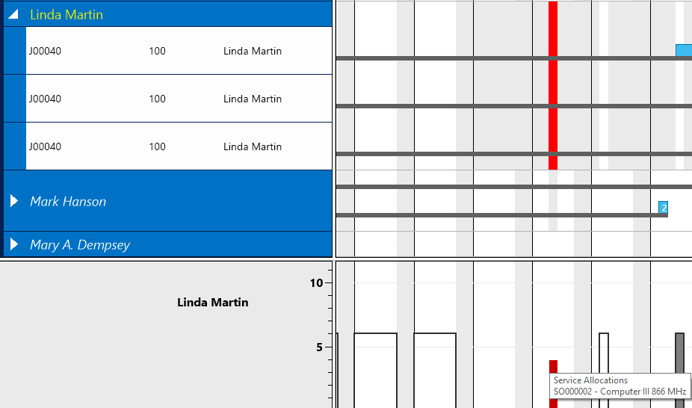
#1 External resource utilization causing an overload
Allocations of the modules Service and Assembly and from jobs that are not currently loaded into the VJS and that have already caused an overload at the corresponding resource, are indicated by a red bar in the diagram area and a corresponding capacity curve in the histogram. The histogram's tooltip (also available in the Histogram View) informs you which module/job is blocking the resource.
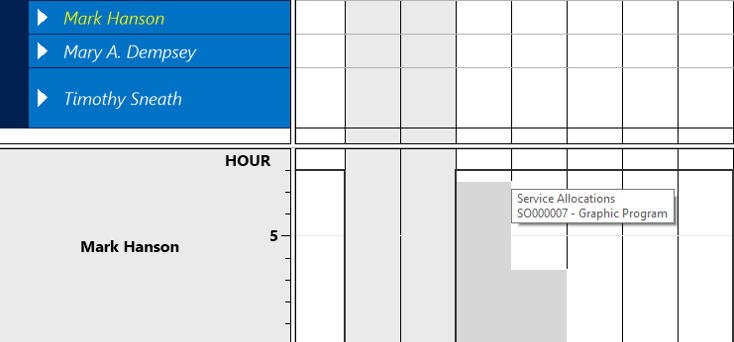
#2 External resource utilization causing no overload and no full capacity usage
Allocations that don't cause overloads and don't lead to a full capacity usage are represented by a light grey capacity curve in the histogram which lets the planner directly recognize that the resource is only partly assigned and therefore could be taken into account for the planning. Here again the histogram's tooltip informs you which module/job is blocking the resource.
#3 No capacity at the resource
There are two reasons for a resource to have no work capacity at a certain date:
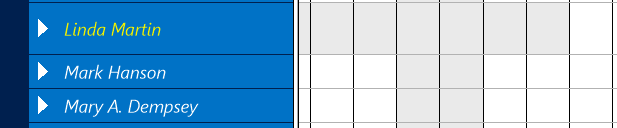
- The work capacity of this resource at this date/s was set to 0:
This will be indicated by a leight grey bar in the diagram area. The planner will directly recognize that this resource can't be taken into account at this certain date.
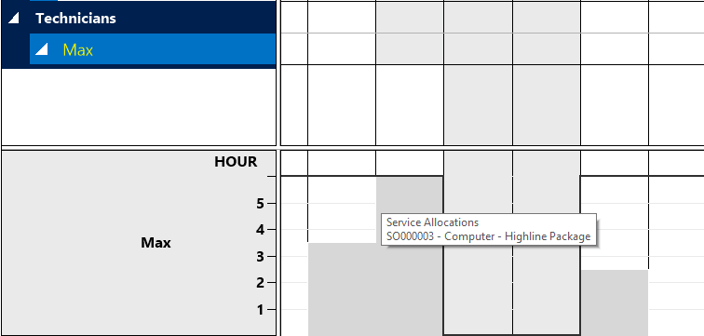
- External allocations fully block this resource:
A light grey bar will appear in the diagram area together with a light grey capacity curve in the histogram.
More information
- Webinar about the new features of the VJS.
- Want to know what are the three top features to show when demoing on the Visual Jobs Scheduler?
- Ebook about Visual Scheduling for Microsoft Dynamics NAV: