Version 1.5 of both the Visual Production Scheduler and the Visual Jobs Scheduler have been released as of lately. These releases don't offer as many new features as you may be accustomed to from us, but this doesn't mean, of course, that we have been idle. On the contrary, to further improve our products and offer you the best possible user experience we decided that in this release we would do a lot of streamlining and consequently have strongly focused on product maintenance in the form of bugfixing and performance improvement.
For you and me, this means that we have more space and time to deal with the main new feature of the VJS and explain it in detail, with a little theoretical excursion into the world of formulas. As always, the complete release information can be found in the respective notes for VPS and VJS.
How to track the progress of jobs and job tasks
One of the crucial problems in project management is, of course, keeping the promised delivery dates and thus gaining satisfied customers.
In Dynamics 365 Business Central, keeping track of a job's (or job task's) progress is provided by ledger entries and time sheets that - naturally - have to get filled and maintained continuously. However, even experienced users of the Jobs module of Dynamics 365 Business Central have already lost themselves many a time in the depths of its cards, thus not getting the instant and clear-cut overview they desire (and need).
Again, as is often the case with the sometimes a bit cumbersome Dynamics 365 BC, this is where a smart visualization comes into play: the VJS now shows both the progress of jobs and of job tasks as having been entered in the ledger entries and time sheets of Dynamics 365 Business Central. (If you are interested in how to effectively manage ledger entries and time sheets, watch the recorded webinar "The 1x1 of visual resource & project scheduling (VJS)", use case 2.)
- The job's progress is represented by a green line beneath the bar, providing a rough overview

- The task's progress can be recognized by a number beneath the bar, drilling down in the job's progress and providing a fine overview.

This is what is on the outside of our new feature, but every now and then customers ask us what lies behind this progress information, i.e. how the progress is calculated. Please forgive me if for explaining this I have to spell out a little theory ;-)
Theoretical excursion
The calculation of either the job's and the job task's progress is based on a formula.
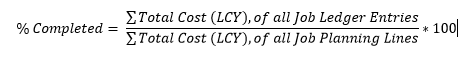
Calculation of the job's progress
The value for % Completed of a Job is calculated by dividing the sum of the field Total Cost (LCY) of all Job Ledger Entries of that job with Entry Type "Usage" by the sum of the field Total Cost (LCY) of all Job Planning Lines of the Job that are Schedule Line, which means Line Type "Schedule" or "Both Schedule and Contract", and multiplying the resulting value by 100.
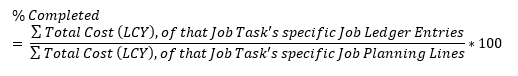
Calculation of the job task's progress
The calculation for the field % Completed on a Job Task Level takes the same calculation and only filters the Job Ledger Entries and Job Planning Lines further down to the Job Task. This produces the Usage Total Cost (LCY) sum and the Schedule Total Cost (LCY) sum on a Posting Job Task. Through the hierarchy this can then be accumulated so that every Job Task level has its own corresponding value.
So in other words the calculation for a Job Task takes the same formula and only supplies the Job Ledger Entries and Job Planning Lines associated with that particular Job Task.
So, enough theory for today - I hope you enjoyed my little excursion! Speaking of excursion - read about how walking a long-distance trail is essentially scheduling many hikes.
More information
- Watch a recorded webinar about the Visual Jobs Scheduler or sign up for an upcoming one.
- Browse our knowledge base.
- Download our ebook about visual scheduling for Microsoft Dynamics NAV: