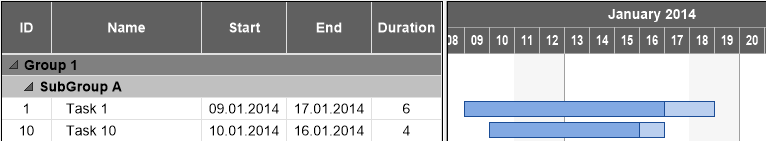
Whether an operation needs a rest time after processing and how long this will be is an important information for the production planner and hence should be visualized in his planning table. In the daily life of manufacturing companies you can find a lot of examples for operations with rest times: After varnishing, a table top has to dry for 24 hours before it can be further worked on. In theory, visualizing rest times in the planning board is very easy: you have to create a node with two layers – the first one visualizing the operation, the second one the rest time. One of our VARCHART XGantt customers recently asked how he could visualize rest times that can also be outside working hours, if, e.g., the drying phase of the paint falls on a weekend. For this, you have to take into account the “Duration field” setting in the Edit Layer dialog for the “Wait Time” in VARCHART XGantt. Click here to learn more:
Visualization of rest times independent from working hours
In VARCHART XGantt you can define layers for wait times that are used für setup times, for instance. These wait time layers can also be used for rest times, with one significant difference, however: the Duration field has to be empty.
Why is that? To grasp this, you have to understand how VARCHART XGantt visualizes the length of a layer. To calculate the layer length, VARCHART XGantt uses three components: start date, duration of the operation and working calendar of the resource. From these three factors, the operation’s end date will be calculated. Using the working calendar makes sense because the resources’ working time directly influences the end date.
Rest times, however, don’t use resources and can also take place during non-working hours.
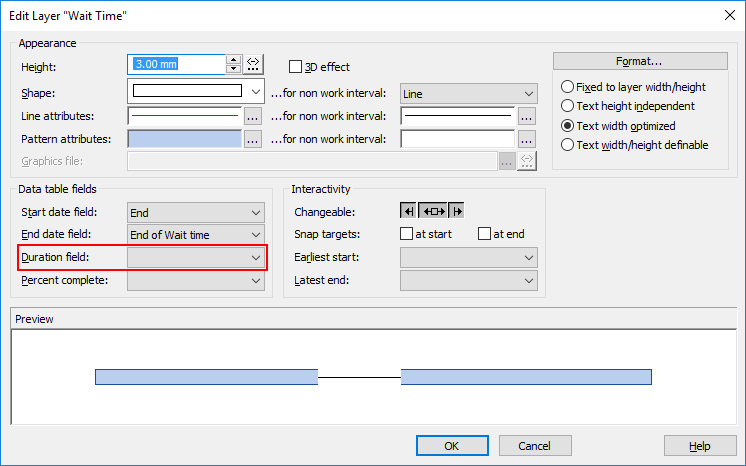
For this reason, the work calendar must not be taken into account when calculating these layers. Instead, a start and end date must be specified and the setting for the duration must not be activated.
To stay with the example with the table: The start date of the rest period results from the end date of the painting work on the table top. The end date of the rest period is defined from the start date of the rest period plus the defined rest period, but without consideration of the work calendar. Therefore in the figure above you see the entry "End" as Start date field and "End of Wait Time" as End date field.
Want to learn more VARCHART XGantt tips & tricks?
Here are some more blog post, I would like to recommend:
Swap Tasks Via Table Interactively
Enhanced Snap Tools Ease Dragging in Gantt Control
Do you know that our VARCHART XGantt control has a live-update function? This means that if you move a task you immediately see the consequences for all other related tasks during the interaction. Download our free whitepaper for best practices.