Our tagline at NETRONIC has been "visual scheduling software" for quite a while. We selected the phrase "visual scheduling" on purpose. It mirrors best what we are good at. And it reveals where we aim at excelling.
Even more: we are convinced that it is the aim for "visual scheduling" that makes our scheduling products stand out. Also, it is the approach of "visual scheduling" that delivers the utmost value to our clients.
"Visual scheduling" has become what we live and breathe day by day. It is a phrase that we keep on using, and that customers and partners started to use when they talk about us.
This post is meant to provide an answer to the question "what is visual scheduling?". First, I provide this answer in a general way. Second, I then focus on Microsoft Dynamics 365 Business Central and visual scheduling.
Origins of the phrase "visual schedule"
Fair enough: We did not invent the phrase "visual schedule". It originates (to my knowledge) from applied behavior analysis. A visual schedule is a systematic technique that enhances learning and communication for individuals with an autism spectrum disorder.
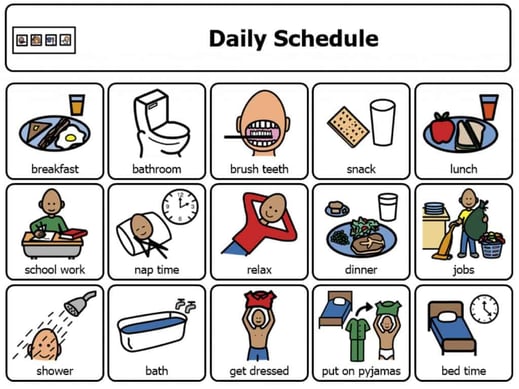 Visual schedules are a proven tool to ease communication for children with autism. Most autistic children find it stressful when there are changes to their routine. Hence, visual timetables help them to understand what's happening next without causing stress.
In that context, a visual schedule tells the individual what is going to happen and in which sequence. It provides the child with a clear structure. It enables her to make decisions about the next step on her own without the need of her parents telling her.
In its thus original form, the benefits of a visual schedule are manifold and obvious:
- It utilizes the children’s visual strengths. Hence, it provides a receptive communication system to increase understanding.
- It supports learning new things as children get used to mastering tasks that they perceived as unexpected.
- It increases the individual’s flexibility.
- It helps the individual to develop independence and resulting self-esteem.
From NETRONIC's origin (Gantt charts) to visual scheduling
As you might know, we as NETRONIC have been developing Gantt chart software for more than 4 decades. First, Gantt charts visualize time- and resource-oriented planning data. Second, Gantt charts support users in visually planning projects, production, and resource usage.
The value of a Gantt chart is comparable with the mentioned benefits of a visual schedule for the autistic child:
- Gantt charts provide transparency.
- They help to master the unexpected (and to efficiently reschedule).
- Thus, they provide flexibility - or (as we call it) operational agility.
These parallels are striking. They encouraged us to broaden our focus. Thus, we no longer solely concentrate on the tool we develop (Gantt chart). Instead, we additionally look at the process of what our customers do with these Gantt charts. This conclusion lets to our mission statement:
We want to enable our customers to gain operational agility with visual scheduling.
Do you see? We turned the tool (visual schedule) into a process (visual scheduling). This, by the way, was as crucial as understanding the impact of a visual schedule. It was crucial because it focused our attention on what "scheduling" is.
The difference between planning and scheduling
Oftentimes, people use words like "planning" and "scheduling" as they were synonyms. Yet, we say "visual scheduling" (and not "visual planning") with purpose. Hence, I'd like to point out what the difference is (and why that difference is so important).
Planning focuses on what to make, roughly when to make it, and in some applications also where to make it. It brings together the general sales plan (or the demand forecast) with the capabilities to make items. Planning works in "buckets" of time (e.g. months or weeks). Planning is more rough-cut, and it has to be. It oftentimes works with the assumption of infinite capacity. This assumption helps companies to spot areas needing an increase in capacity. Thus, planning processes can result in companies making changes to their capacity. They want to make sure that they can - on average! - build to the projected demand.
Instead, scheduling defines the exact when and by whom to make it. Scheduling takes the planning output as input data. It then boils down the rough plan into a concrete production order and resource sequence. When scheduling, people decide when exactly and who exactly does a job. Scheduling puts the plan into action. It takes into account much more concrete restrictions than planning. It is much more short-term, and much more concrete.
Scheduling has to recognize
- (finite) capacity,
- time constraints,
- delivery dates,
- or other restrictions such as material availability.
When we say visual scheduling, we mean scheduling. We refer to production order and resource sequencing.
Our products do not create production orders based on a demand forecast. Or based on actual or predicted sales orders. Our products take those production orders resulting from production planning as input data. We work with the production order data (coming from planning). We thus help our customers to build an actionable production schedule from it.
Visual scheduling vs. (non-visual) scheduling
Now that it is clear what we mean with scheduling, let's look at the adjective "visual" (and why that matters to us).
Let us jump back to the introductory example of a visual schedule as a tool for autistic children. It helps kids to understand what they should do. And it supports them in making decisions and changing the schedule.
We can deconstruct this example. This helps us to understand the two facets of visual scheduling. Both are completely interwoven:
- Visual scheduling is a visualization technique
- Visual scheduling also is the process of doing scheduling in a visual way
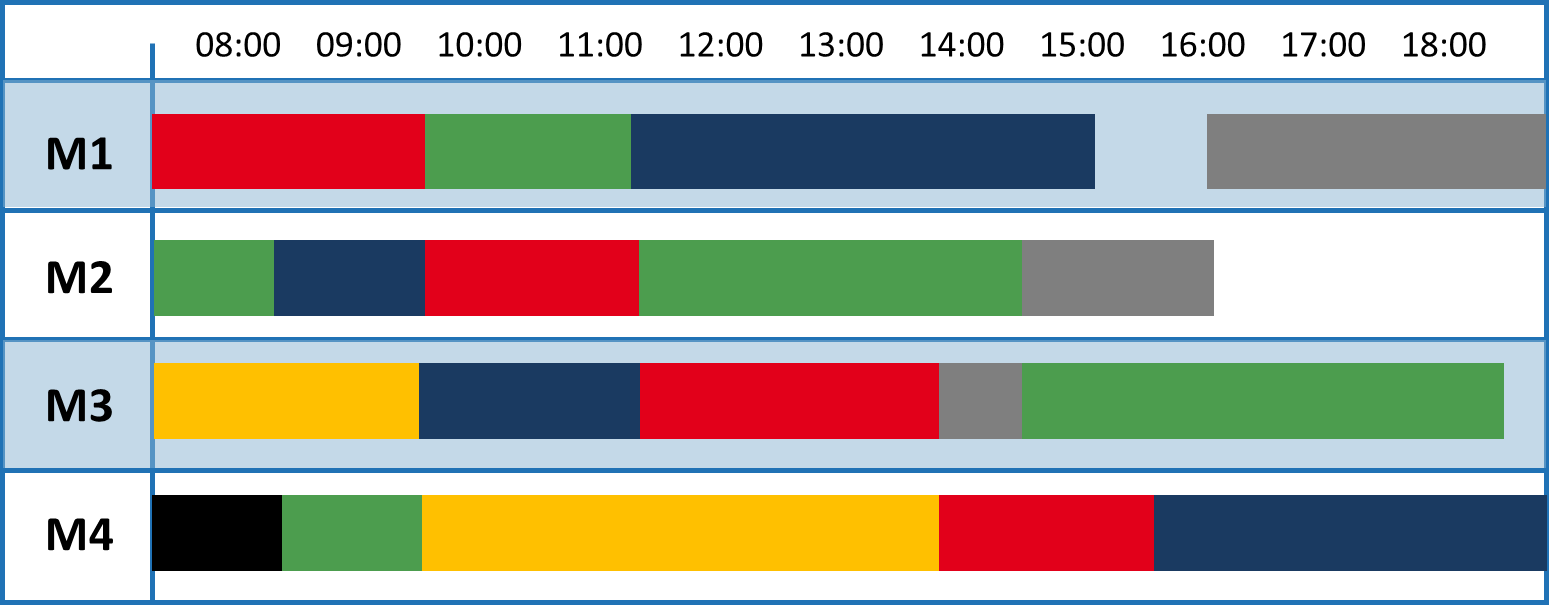
The first facet is very obvious. When you think of a visual production schedule, you most likely have a form of a resource Gantt chart in mind. Such a Gantt chart shows you the timeline at the top. You see your resources on a left-hand table. The production orders/operations appear in the graphical part of the Gantt chart. That way, you can see which operation is assigned to which concrete resource when.
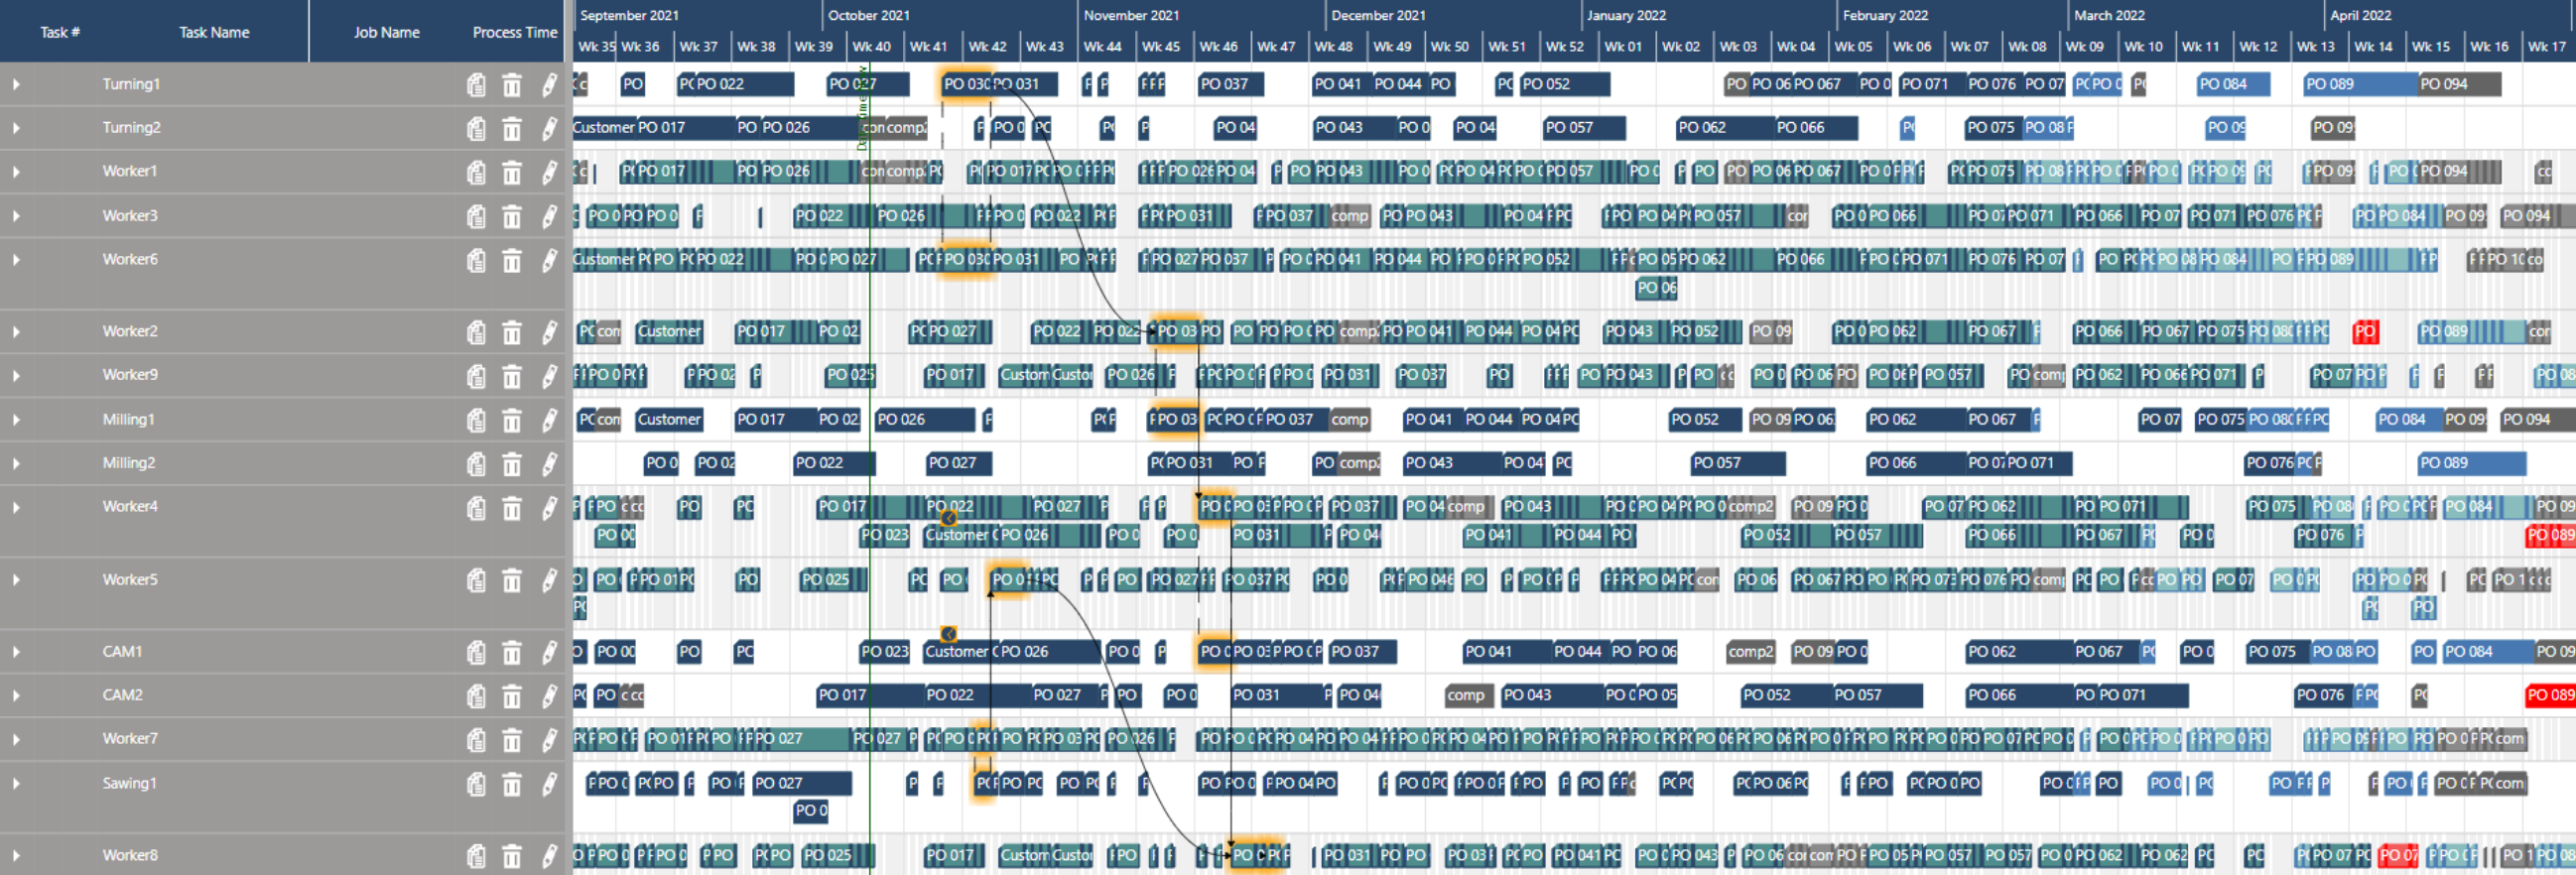
As this is obvious, let's move to the second facet. It states that visual scheduling also is a process. Literally speaking, this facet makes the above-mentioned (resource) Gantt chart interactive. It provides the user - aka the scheduler - with tools to change the schedule:
- to change the timing of operations
- to change the production order sequence
- to change priorities
- to change resource assignments
- etc.
In our understanding of visual scheduling, it is important that the user controls the schedule. He needs to understand what is happening. Thus, visual scheduling is not: Have an algorithm that "magically" does the production order and resource sequencing. Then look at the result in a visual schedule. Then change the algorithm's parameters, and schedule again.
We are not at all against algorithmic scheduling. But, production order and resource sequencing algorithms should be
- understandable
- clear
- and focused.
Focused means that they get triggered as a dedicated (visual) scheduling action. The algorithms must get executed from within the visual schedule.
Let's sum this up.
Visual scheduling is the process of visually scheduling with the help of dedicated scheduling tools and algorithms, that are clear to the user.
Visual scheduling for Dynamics 365 Business Central
We provide three different visual scheduling extensions for Microsoft Dynamics 365 Business Central.
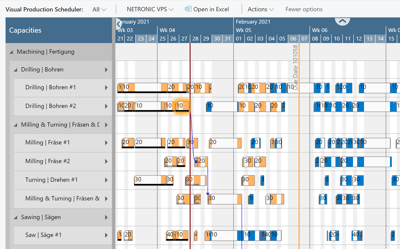 The Visual Production Scheduler (VPS) is the drag & drop frontend to standard Business Central manufacturing.
It provides users with a visual schedule in form of
- a production order Gantt chart
- a resource Gantt chart
- and a load view.
The majority of the scheduling tools supporting the scheduling process are visual. However, simple algorithms help the user not to violate some restrictions. For example: when dragging an operation, the successors can get moved automatically.
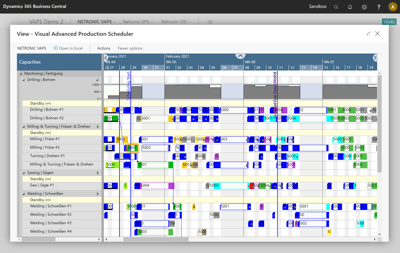 The Visual Advanced Production Scheduler (VAPS) is the first finite capacity scheduler fully integrated into Business Central.
Of course, it provides users with a visual schedule in form of
- a resource Gantt chart
- a production order Gantt chart
- and a sales order Gantt chart.
Other than the VPS, it comes with a lot of (semi-)automatic scheduling tools and an algorithm that always schedules with finite capacity.
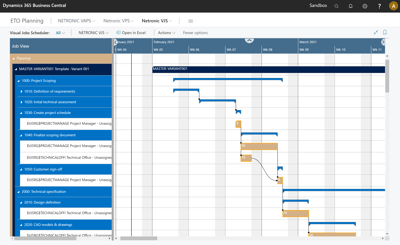 The Visual Jobs Scheduler (VJS) is the drag & drop frontend to the standard Business Central jobs and resource planning modules.
It provides users with a visual schedule in form of
- a project order Gantt chart
- a resource Gantt chart,
- and a load view.
Like with the VPS, the majority of the scheduling tools supporting the scheduling process are visual. However, simple algorithms help the user not to violate some restrictions. For example: when dragging a job task or a job planning line, the successors can get moved automatically.
Want to learn more about visual scheduling for Microsoft Dynamics 365 Business Central?
Download our free Ebook "introduction to visual scheduling for Microsoft Dynamics 365 Business Central".