If you are looking for an easy way to visualize your data from your Microsoft Dynamics 365 Business Central industry solution, the Visual Scheduling Add-in Developer Toolbox (VSADT) with AL/CAL API is the right tool for you. Now we have released a new version with further functions that let you design a powerful, interactive graphical planning board reflecting the business logic of your solution.
Allocation rows in the Resources View
As of version 5.0 of the VSDAT, you can create the resource allocation as an additional row in the order view and thus view the operation/task/activity plus the associated resource at a glance. With the new setting PM_AllocationRowsVisibleInResourcesView you can now also activate the display of allocation rows in the resources view. If you set this setting to True, the allocations of each resource are displayed in their own rows. One advantage of the allocation rows is that you can now permanently display further, more detailed information on the respective allocation in the table part instead of using volatile tooltips.
Extensions of tooltip templates
Tooltips are an important tool for displaying additional information about diagram elements to the user, if required, without overloading the diagram itself. To make the definition of tooltips easier, the VSDAT offers the powerful concept of tooltip templates. This allows you to define a template only once for a specific object type (e.g. for activity bars) and then the control add-in will replace placeholders inside the template by values of referenced object properties at runtime.
To complete this powerful concept, we have now added the missing property PM_TooltipTemplateID to the PeriodHighlighterEntry object.
Another helpful extension are default templates. This means that you no longer have to assign a template to each object individually. For each object type it is now possible to specify a default template by setting one of the following settings:
PM_DefaultActivityBarTooltipTemplateID,
PM_DefaultActivityRowTooltipTemplateID,
PM_DefaultAllocationBarTooltipTemplateID,
PM_DefaultAllocationRowTooltipTemplateID,
PM_DefaultEntityRowTooltipTemplateID,
PM_DefaultLinkTooltipTemplateID,
PM_DefaultPeriodHighlighterEntryTooltipTemplateID,
PM_DefaultResourceCurveTooltipTemplateID, and
PM_DefaultResourceRowTooltipTemplateID.
New pinning points for links
Although the Visual Scheduling Add-in Developer Toolbox supports different link types to display finish-start, start-start, or finish-finish relationships between activities or allocations, this is not flexible enough in some cases.
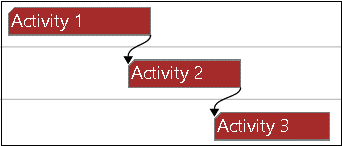
Imagine, for instance, that an activity consists of a setup phase, a pure processing phase, and a tear-down phase. Further, let’s suppose, that such an activity can already start with the setup while the previous activity is still in progress. Or an activity can start while the previous activity is still in the tear-down phase. Then it would be nice to visually represent such a situation in an appropriate manner.
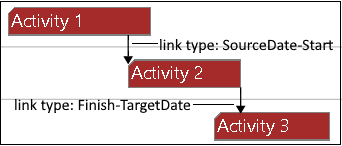
For this purpose, we have added the new properties LinkSourceDate and LinkTargetDate to activities and to allocations as well. With these properties, you can set other pinning points for the links than just the start or end of an activity or an allocation bar. In addition to these two properties, you must also assign one of the newly created link types to the links. The new types are SourceDate-Start, SourceDate-Finish, Finish-TargetDate, Start-TargetDate, and SourceDate-TargetDate.
The two figures below show examples of the “classic” representation compared to the new one:
More flexibility for release and due date symbols
So far, the activity properties DueDate and ReleaseDate have been symbolized by a diamond shape that was predefined and could not be changed.
Now you can customize the symbols to your needs. For this we have added the activity properties PM_ReleaseDateSymbolID, PM_ReleaseDateSymbolHeight, and PM_ReleaseDateSymbolWidth to be able to use your own symbols. Analogously, we have included PM_DueDateSymbolID, PM_DueDateSymbolHeight, and PM_DueDateSymbolWidth properties for the due date.
But the extension goes even further because now you can also interactively move the symbols for both dates. For this purpose, the new properties PM_ReleaseDateAllowedDragModes and PM_DueDateAllowedDragModes provide the same flexibility to specify allowed interactions as you already know from the “normal” bars.
Enhancements on locales
There are two important enhancements in the field of locales. First, we have added three more locales. The control add-in now also supports Chinese, Japanese, Russian, and Thai.
Secondly, we have added the new setting FirstDayOfWeek. Till now, the first day of the week was either hardcoded in the locales or it could be overridden by the implicit setting of the setting WeekNumbering. Now the first day of a week can be explicitly set by this new setting. This gives you the flexibility to customize your application for Arab countries, for instance, where Saturday is the first day of the week.
More information at click events
When the user clicks or double-clicks on a chart element (e.g., a bar or a table row), the Visual Scheduling Add-in Developer Toolbox can inform the application about it by triggering the callback events OnClicked and OnDoubleClicked. The parameters of these functions provide the application with detailed information about the affected elements.
We have extended these parameters in two cases. When the user (double-)clicks within the table part, the index of the hit table cell will be passed to the event. Thus, the application can react to user interactions with cell precision.
And the same way, the control add-in passes the index of the symbol when the user (double-)clicks on one in the symbol column of the table. This means that from now on these symbols are no longer purely representative but are interactive elements. Great improvement, isn’t it?
New scrolling methods
Although the control add-in already has two powerful scroll methods with ScrollToDate and ScrollToObject, we have added new methods that will make life easier for some of our customers. The missing functionality was that there was no easy way to scroll to the top, bottom, left, or right of a chart using API calls. The new methods ScrollViewAreaHorizontally and ScrollViewAreaVertically close this gap.
What is special about these methods is that you can scroll the table, the Gantt area, and the entities table separately.
Miscellaneous
The TableRowDefintion object has new properties to color a table row: BackgroundColor and TextColor. Of course, both colors can be overridden by the corresponding properties of a cell definition.
The API of the control add-in has grown over the years. Therefore, from time to time it is necessary to clean up the API. This category also includes some renaming that we have done to settings with the Header substring inside the name. For clarification, we have replaced this substring with Title. To ensure compatibility, the old settings names remain available on the interface, but they are marked as deprecated. This change affects the settings
PM_TableTitleBackgroundColor, PM_TableTitleTextColor, PM_TableTitleColumnSeparatorColor, PM_TableTitleHighlightingColor, PM_EntitiesTableTitleBackgroundColor, PM_EntitiesTableTitleTextColor, PM_EntitiesTableTitleColumnSeparatorColor, and PM_EntitiesTableTitleHighlightingColor
Conclusion
We are sure that you will appreciate all the new features of the Visual Scheduling Add-in Developer Toolbox. If you are already using our control add-in, then give them a try. And if you are still looking for a powerful component for interactive Gantt charts within Microsoft Dynamics 365 Business Central, we can only encourage you to take a closer look at this product.