Production scheduling is in no way a trivial task. Many small and medium-sized companies, therefore, already rely on or have decided to use an enterprise resource planning (ERP) system like Microsoft Dynamics 365 Business Central to help them better manage their business. And, of course, the ERP provides valuable assistance for running the business in an integrated way. To do so, it provides data and extracts and presents information in a meaningful manner.
But especially getting started with Dynamics 365 Business Central can be tricky. I'm sure that there are a lot of users that could report on their painful experiences as a newbie to the system. A lot of knowledge is needed to work with Business Central and looking at it for the first time it can be really overwhelming.
In this blog post I'd like to shed some light on how transparency and simplicity can be added to Business Central, thus easing the way into quickly using the ERP efficiently and profitably.
Imagine a manufacturing company that up to now has managed their complete processes in a, let's say, very analog way. Perhaps they already use an ERP and manage their scheduling and planning in a (more or less) extensive Excel sheet and they do a lot of exporting and importing of data between Excel (and perhaps their ERP).
At this point, the management notes that things cannot go on like that and decides that from now on the planning will no longer be done on paper but with Business Central. And - all of a sudden - the planner has to work with BC. Of course, there will be trainings, but, as I stated above, BC can be quite overwhelming.
In this scenario where users might not see the forest for the trees, we think that a visualization tool will help, because - as the saying goes - "a picture is worth a thousand words".
A visual planning tool aka a graphical planning board makes the processes that happen within Business Central transparent to the users thus helping them to learn and understand how Business Central works (and this not only applies to beginners). Making these processes transparent, at the same time simplify working with them, of course.
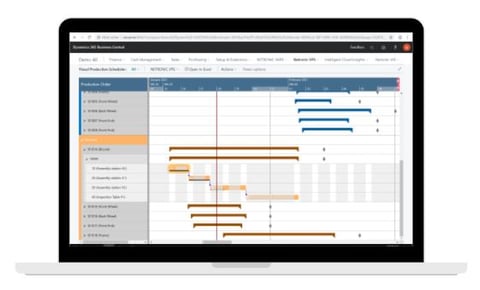
Let me illustrate what I have said with some short examples taken out of a planner's daily life. The visualizations come from our two different visual production scheduling apps for Microsoft Dynamics 365 Business Central: the Visual Production Scheduler (VPS) and the Visual Advanced Production Scheduler (VAPS).
Clear-cut overview of production orders and capacities
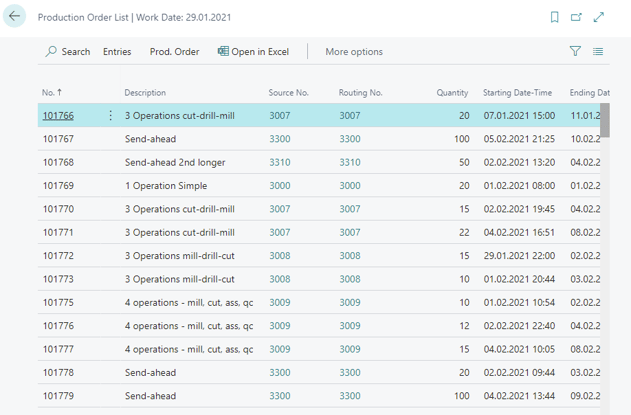
As I said above, all data in BC are somewhat "hidden" on cards and in tables. Especially for a beginner, finding certain data, or even setting up things can at least be cumbersome, if not confusing. Have a look at the card below, that lists all my production orders:
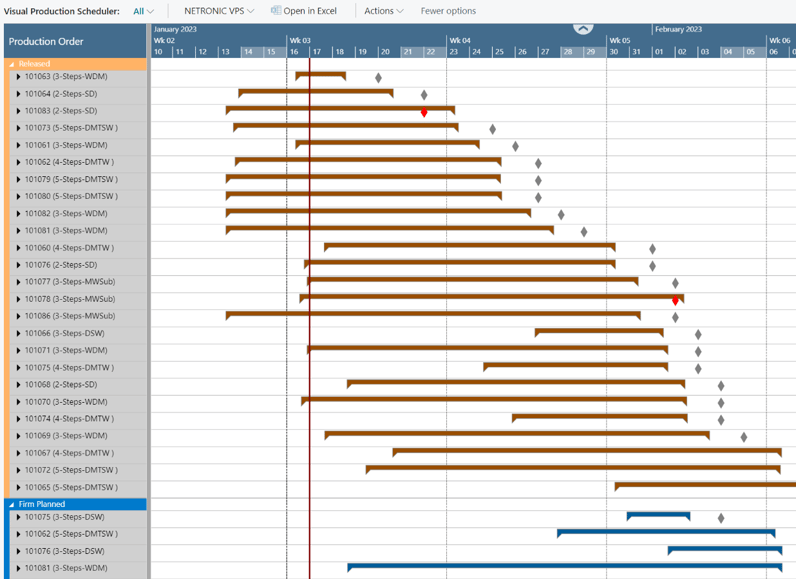
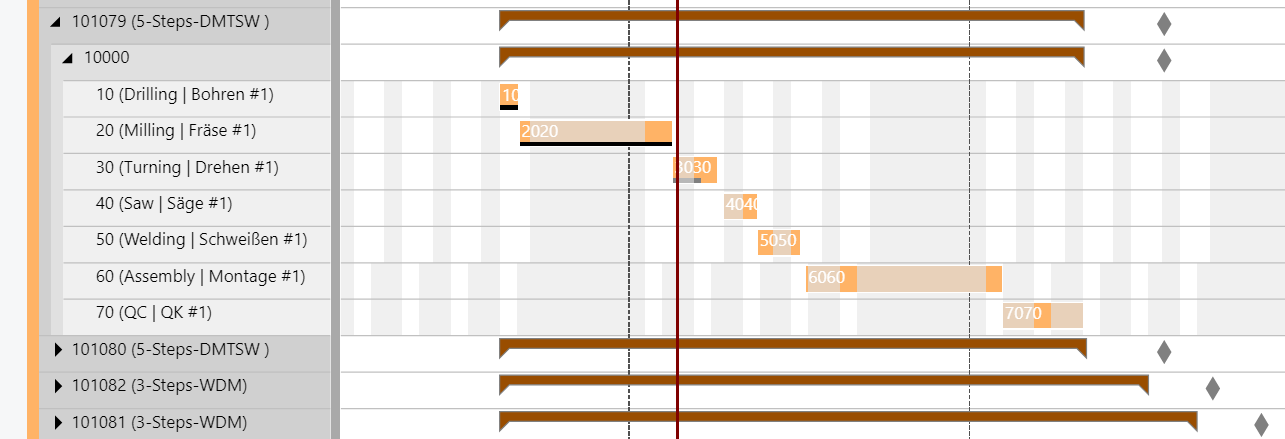
Wouldn't it be much more appealing and easier to understand if your production orders appeared in a nice clear-cut overview like below? And by the way: with the below view, you see the most important production orders (released with the due date close to today) at the top. Pro benefit: you also see those that are late (red symbol).
Now, let's drill down one layer. In Business Central, you can go from one production order to the production order line, and then the routing. The routing in Business Central looks as follows:
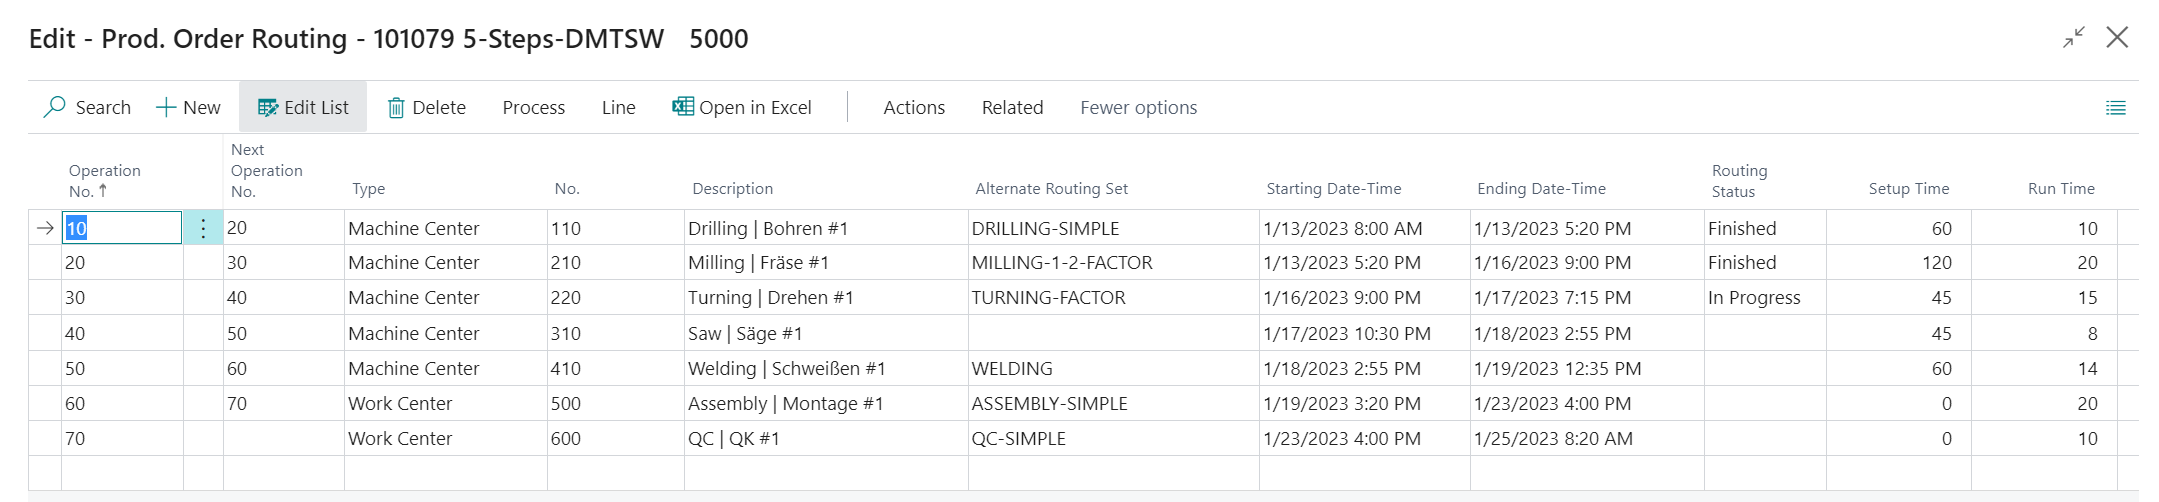
In a visual scheduler, the routing is presented graphically. If you look thoroughly, you also see the routing status (finished and in progress):
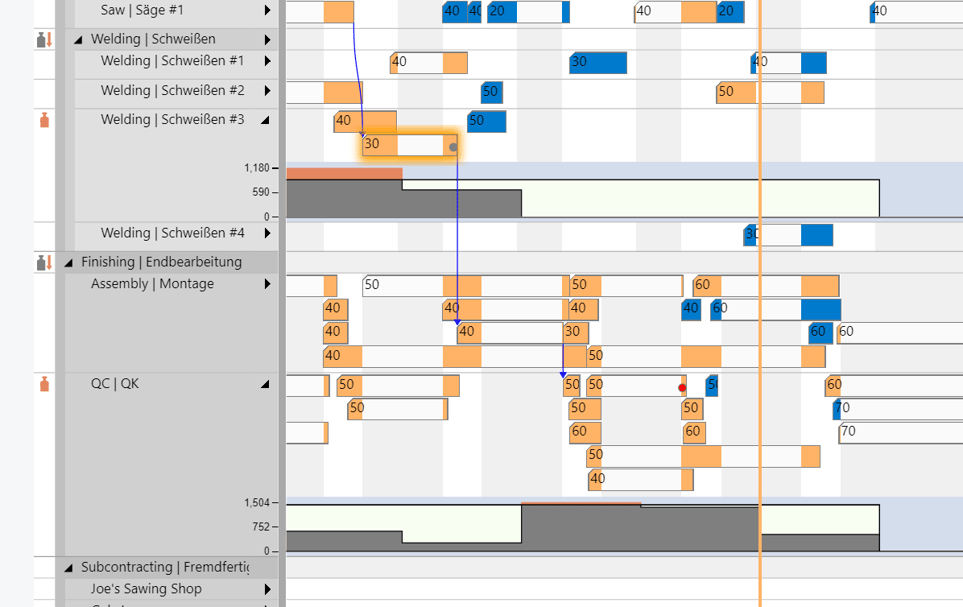
Let's have a look at the capacities. Instead of having to collect all data from different cards and tables, our extensions give you an overview of your capacities, grouped by work center groups and work centers. You get visual warnings in case of overloads and by capacity curves you can monitor the total utilization of a work center group.
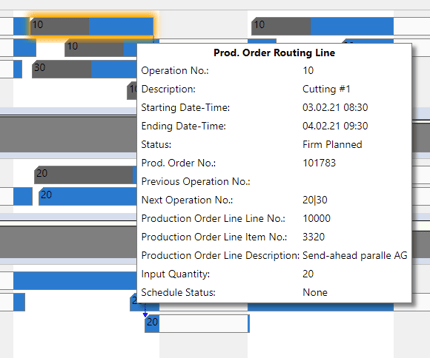
What's more, in all views you get meaningful additional information in the form of tooltips that even can be customized.
Interactive changes via drag & drop
Instead of painstakingly entering changes to e.g. beginning/ending dates of an operation on the said cards and tables, you can carry these changes out by simple mouse actions – horizontally to modify start and end dates or vertically to modify assignments to different work or machine centers. The good thing is - you immediately see the impact on your plan
I hope I could show you how adding visualization to the Business Central manufacturing module can bring transparency and with this also simplicity to the ERP, thus helping to facilitate the learning of this complex system. Of course, our extensions offer a lot more features in this regard. Do you want to know more about visual scheduling in Business Central? See below for further information👇.
Take a deeper dive into how to gain transparency and simplicity in Dynamics 365 BC
- Watch our recently recorded webinar "How manufacturers can leverage on transparency & simplicity with Business Central"
- See how our customers have benfitted from the advantages of a visual planning board in our reference stories.
- Read our complimentary Ebook "Introduction to Visual Scheduling for Microsoft Dynamics 365 BC".