Are you getting along with our series on how to develop powerful visual scheduling applications with VARCHART XGantt? If you have followed all steps, you will have a considerably comprehensive Gantt application by now: you have installed our .NET Gantt control, have started working with the sample library, have loaded your data into the control, you know how to change the time unit and modify the time scale and perhaps have structured your Gantt chart by creating groups (as was described in the last blog post).
Our new post wants to make you acquainted with a meaningful usage of layers and filters.
Using Layers
A layer is the graphical representation of a pair of dates. In addition, the same pair of dates can be displayed by several layers. Logically, the different layers stack up to a pile.
In our example, we are now going to create a second, different looking layer.
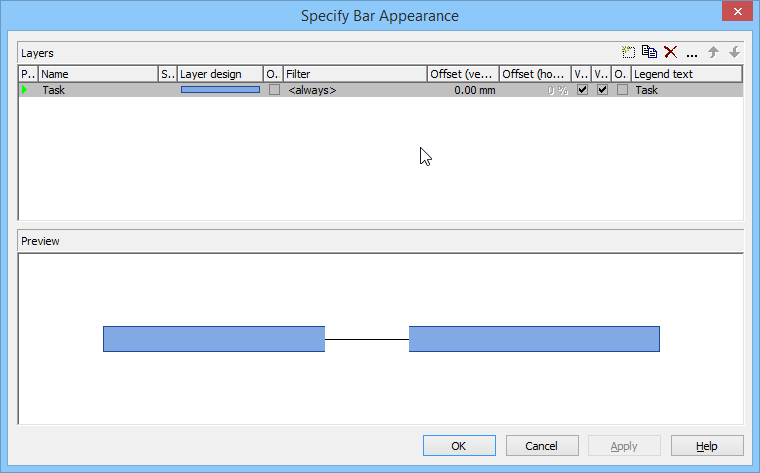
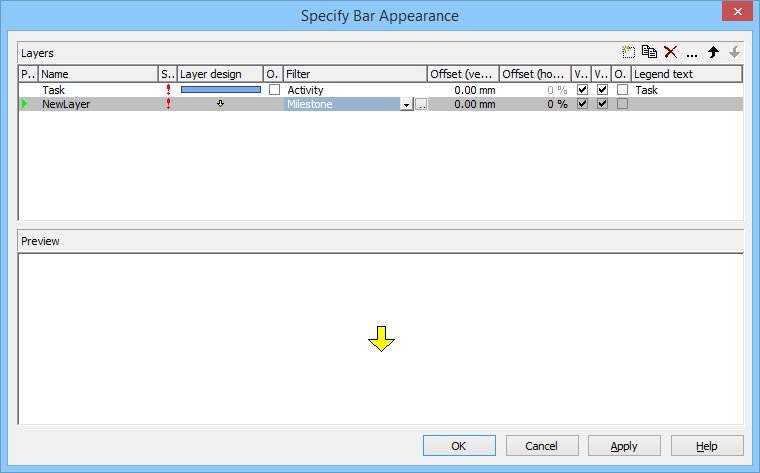
- On the Objects property page, please select Layers.... The dialog Specify Bar Appearance will pop up. You will note that the layer Task has already been created.
- Create a new layer by clicking the corresponding button
 .
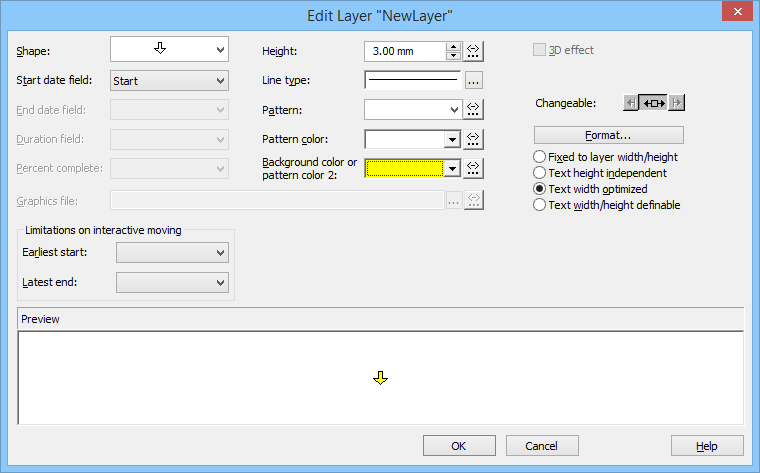
. - The new layer has to be modified now. For this, click on the "New Layer" and then on
 . The "Edit Layer" dialog will open.
 - Please change the Shape to arrowhead downward and the Background color to yellow.
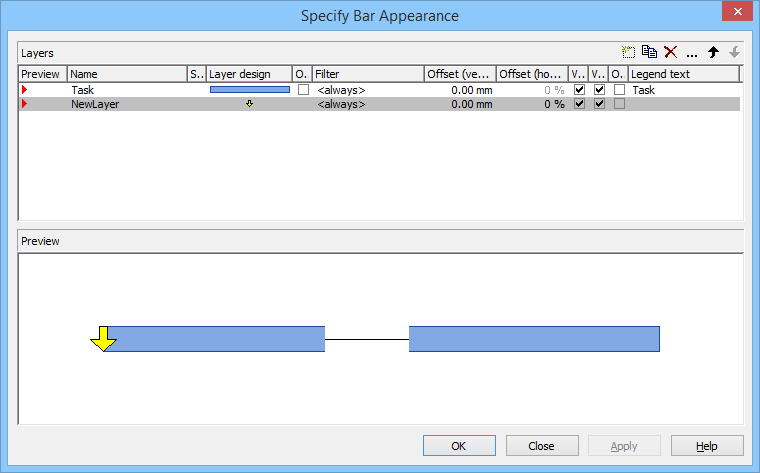
- By clicking on OK, you will return to the dialog Specify Bar Appearance
- Each layer of a node will be displayed in the preview below if you click in the column Preview of the corresponding fields. A red triangle instead of a green one indicates the display of the layer in the preview window below.
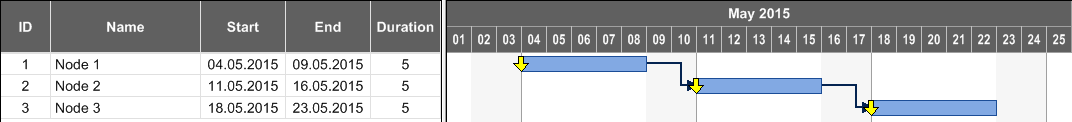
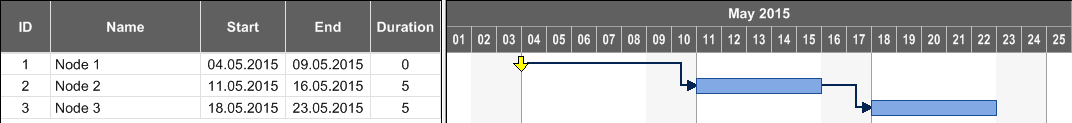
- In our programming sample, the modification of the definition shows the below result:
Using Filters
Next, we would like to have the yellow arrow appear only if the node is a milestone i.e., if the duration of the activity equals 0.
This problem can be solved easily by using filters. A filter consists of a series of linked conditions which result in a logical Yes/No statement.
Layers are always linked to filters. The corresponding layer becomes visible only if the evaluation of the filter conditions results in "Yes". The filter <always>, which is assigned to a layer by default, always returns "Yes". For our example, two filters are required that contain one condition each:
The yellow arrow shall appear if the duration = 0
The blue bar shall appear if the duration > 0
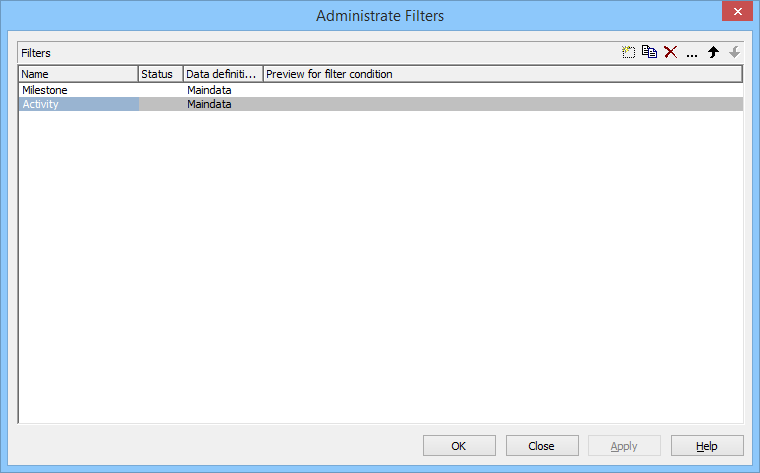
- On the property page Objects please click on the button Filters, which will pop up the dialog Administrate Filters.
- Now please create two new filters by clicking .
- In the column Name rename "NewFilter" and "NewFilter1" to "Milestone" and "Activity".
- Please confirm the modifications by clicking Apply.
- Select the filter "Milestone" and open the dialog Edit Filter by clicking on .
- Select "Duration" as Fieldname, as Operator "equal" and as Comparison value 0
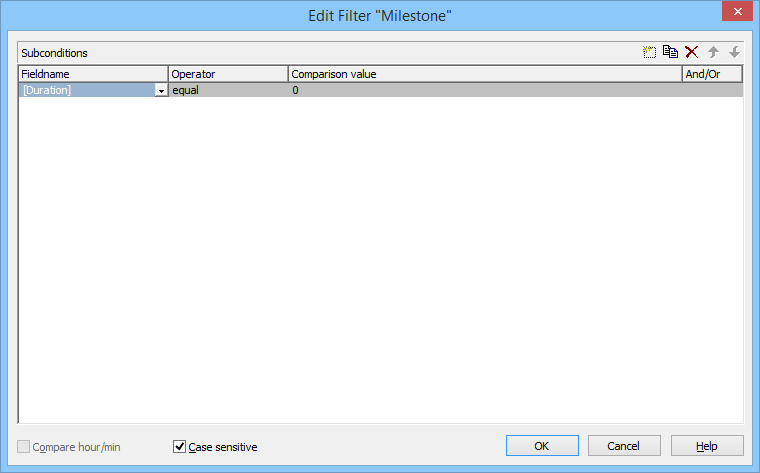
- Leave the dialog by clicking on OK.
- Select "Activity" and by clicking go again to the Edit Filter dialog.
- Select "Duration" as Fieldname, for the Operator "greater than" and for the Comparison value 0.
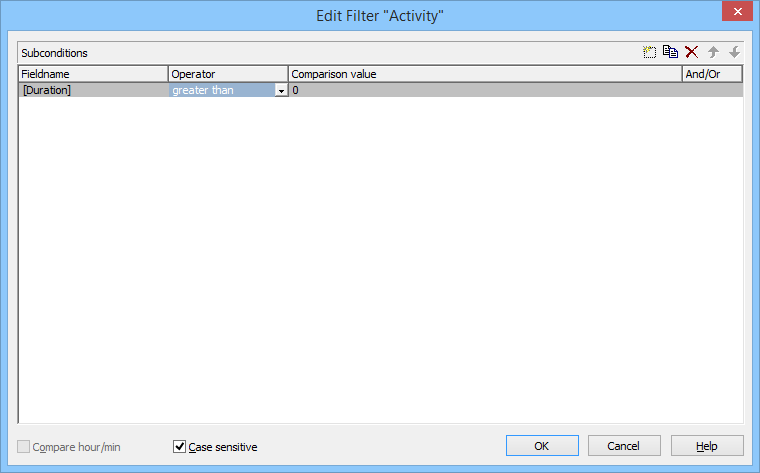
- Confirm with OK.
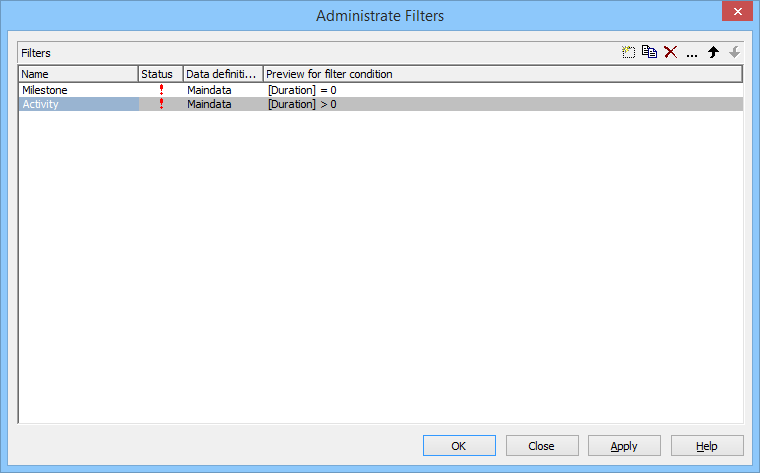
- Close the dialog by OK and return to the property pages.
- To put the filters into operation they need to be assigned to the layers. For this, please click on the button Layers… to open the dialog Specify Bar Appearance.
- If you run the program now and the duration of the first activity has been set to 0, the below result will be produced:
Your next steps
You want to go on programming your application and can't wait for the next sequence of our blog series? We support you by providing a very comprehensive developer's manual, which we highly recommend to use. In addition to this, you can also download our free whitepaper offering 11 best practice tips including code snippets: