Some time ago, I reported on the way NETRONIC helps its customers develop web applications for scheduling or resource planning by offering custom tailored, interactive HTML5 Gantt charts. Since then, things have evolved outstandingly. My update on this is the following blog post about our new generalized model for resource planning that is today the basis of our Visual Scheduling Widget.
During the past years we gained a lot of new experiences developing HTML5 Gantt charts for customers as well as for our products:
- A lot of great projects with many customers from different fields of application have been realized successfully.
- Our cloud based SaaS product just plan it has been successfully extended.
- Our product portfolio was extended by new products for Microsoft Dynamics 365 Business Central.
- We created a new product for our customers, looking for a HTML5 Gantt component: the Visual Scheduling Widget.
Main learning effect during time
All in all, we have gained a lot of valuable experience, not only with the use of HTML5 techniques, but especially with the implementation of scheduling and planning tasks in graphical user interfaces for web browsers.
At the very beginning of our efforts to develop web applications, the focus was on the realization of pure Gantt functionality. First of all, it was important to have a set of tools for integrating interactive Gantt charts into web applications. But the more projects were implemented together with our customers, the more it became clear that the gap between our level of abstraction and the data and application models of the customers was too wide. So, both worlds had to be brought together to better meet the customers' needs.
New & generalized Model for Resource Planning
We recognized that all applications of our HTML5 Gantt charts for all the different domains – whether project management, production scheduling, supply chain management or others – have one thing in common: resource planning. Therefore, we have developed a new data model that generalizes all parts of the different domains that are relevant for visual resource scheduling using interactive Gantt charts.
In addition to the pure data model, we have also created a concept of how to map the members of this data model to interactive graphical representations. This concept and the data model represent our new model for resource planning. Based on this model, we extended our NETRONIC Web Application Framework, which we used internally for developing the custom tailored, interactive HTML5 Gantt chart widgets and that is now available as Visual Scheduling Widget for our customers, as well as for developing our own products in the context of Microsoft Dynamics. So, a broad range of our customers benefits from this new model.
#1 The Data Model
Let´s talk about the data model first:
Objects of the Data Model
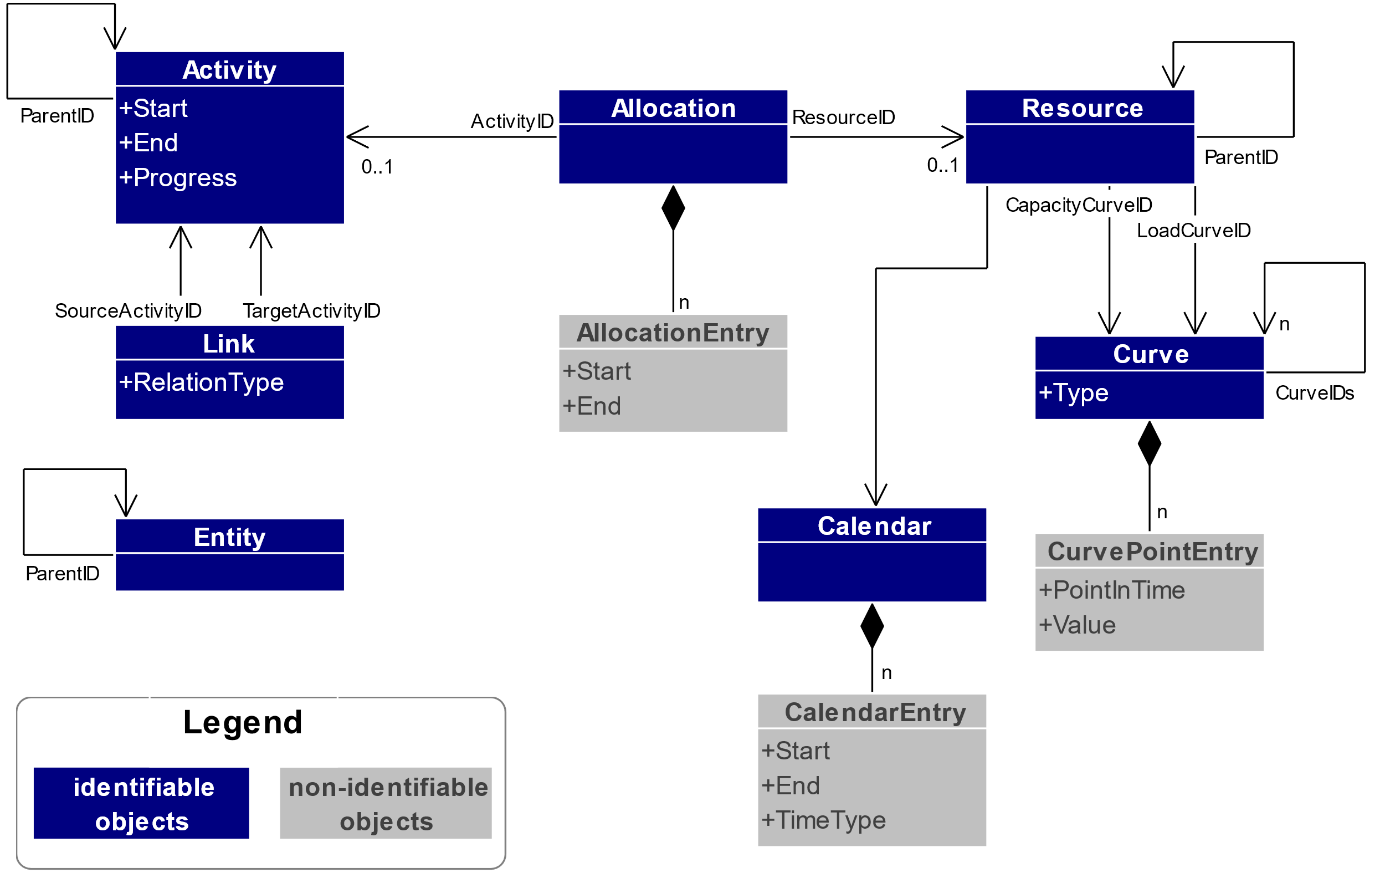
The following list provides a detailed overview of the 7 different types of objects involved in the Resource Planning Data Model and their relationships to each other:
1. Activities
The term Activities covers all actions that need to be accomplished within a certain period of time to achieve a specific objective. Examples of activities are tasks in project management or jobs and operations in production planning.
Start and end dates of an activity are the two important properties that can be the result of a scheduling process or that are predefined.
Activities can be grouped. For instance, in project management a project might be divided into many tasks and each task consist of a set of subtasks and so on. In production planning, jobs are usually subdivided into further jobs and on the lowest level operations are the base activities. Grouping can be achieved by setting the identifier of a parent activity.
Properties such as progress, special types of constraint dates, and baseline dates are also considered in the data model.
2. Resources
Resources, such as machines or personnel, are needed to perform the activities. Besides its general availability defined by a calendar, a resource has a capacity and a load. The latter results from the assignment of activities to a resource and is defined by specific curve objects.
As well as activities, resources might be grouped. Departments consisting of groups of individual resources are examples of a three-level nesting (department-> resource group->resource).
3. Allocations and Allocation Entries
Allocations define the assignments of resources to activities and vice versa. Each allocation refers to a maximum of one activity and a maximum of one resource
In the simplest case, a resource is allocated by an activity for the entire execution period of the activity. Then the allocation will use the start and end dates of the activity itself. But imagine the execution time of an activity is subdivided in different time spans. For instance, if the execution time consists of a setup time, a pure runtime, and a teardown time, a resource may only be required for setup and teardown, but not at runtime. For this purpose, an allocation can have an array of allocation entries. Each entry has its own start and end date and represents a time span. In the above case, we will define an entry for the setup time and another one for the teardown time.
Of course, this concept of allocations also allows to model many-to-many relationships between activities and resources by using multiple allocations with the same activities and/or resources involved.
4. Calendars and Calendar Entries
As mentioned above, calendars are used to define the general availability of a resource without taking into account the specific capacities. Each calendar has an array of calendar entries that determine whether it is a working or a non-working time for a time period specified by a start and an end.
5. Curves and Curve Point Entries
Curve objects are used to handle time-oriented data such as capacities or loads of resources. They can be simple point curves with an array of curve point entries, each entry defining a point in time and a corresponding value. Or they can be stacked curves that are built by adding multiple curves. In this way, you can, for example, add all capacities of individual resources in a resource group to a total capacity of this resource group.
To make working with curves easier, you only need to define entries for those points at which the curve changes its value.
6. Links
In addition to grouping, activities can be related to each other in a different way. Think, for example, of chained production operations or of complex networks project management tasks. In this case, an activity can only be started if the directly preceding activity has already been finished. Such a kind of relations can be expressed by link objects.
Each link is directed and refers to a source and a target activity. In addition to these references, a link has one of the well-known relation types (finish-start, start-start, finish-finish).
Since you can create multiple links with the same source or the same target activity, not only simple activity chains, but also more complex networks of activities can be realized.
7. Entities
This kind of objects is used to manage arbitrary sets of any grouped objects. An entity can be an activity, a resource, or any other object. In practice, entries are used, for instance, for lists of backlog orders that have not yet been scheduled or for lists of available resources with suitable skills that can be assigned to a certain activity.
The Data Model at a glance
The following figure summarizes all object types described above and their relationships. Only those object properties are listed that are essential for understanding the concept of this data model. There are two kinds of objects:
- objects that are identifiable by an identifier and
- objects that are part of an identifiable object, but do not have an identifier of their own.
Further Readings
This is a series of two blog posts. The second part, where I describe our concept of mapping, is published here.
Or have a look at our Visual Scheduling Widget we offer for software companies to integrate in their scheduling solutions to visualize their data in interactive planning boards.
NEW: We have updated our model in December 2019. Please read blog post here.
Both blog posts are also published as e-book. A free updated download is here.