
When you start the development of an HTML5/JavaScript Gantt chart using our Visual Scheduling Widget (VSW for short), or at latest when you discover the VSW option viewType, you will ask yourself: What the hell is the difference between an Activities View and a Resources View, and what view type is appropriate for my concern?
This post will give you an answer and explain the different options each view offers. This approach of the two views with their respective strengths is of course not limited to the VSW alone, but is intended as food for thought for all developers who have to create an HTML5 Gantt chart.
Let’s start with the Resource Planning Model
To answer your question, it is helpful to have a look at our Resource Planning Model, which is the basic concept of our Visual Scheduling Model (please see also the e-book announced in the related blog). On top of the model, we have three object types:
- Activity – a task, a job, an operation or anything like this that has to be done
- Resource – a person, a machine, or a tool that has to perform an activity
- Allocation – the assignment of the resource to an activity or vice versa of an activity to a resource
They are related as follows:
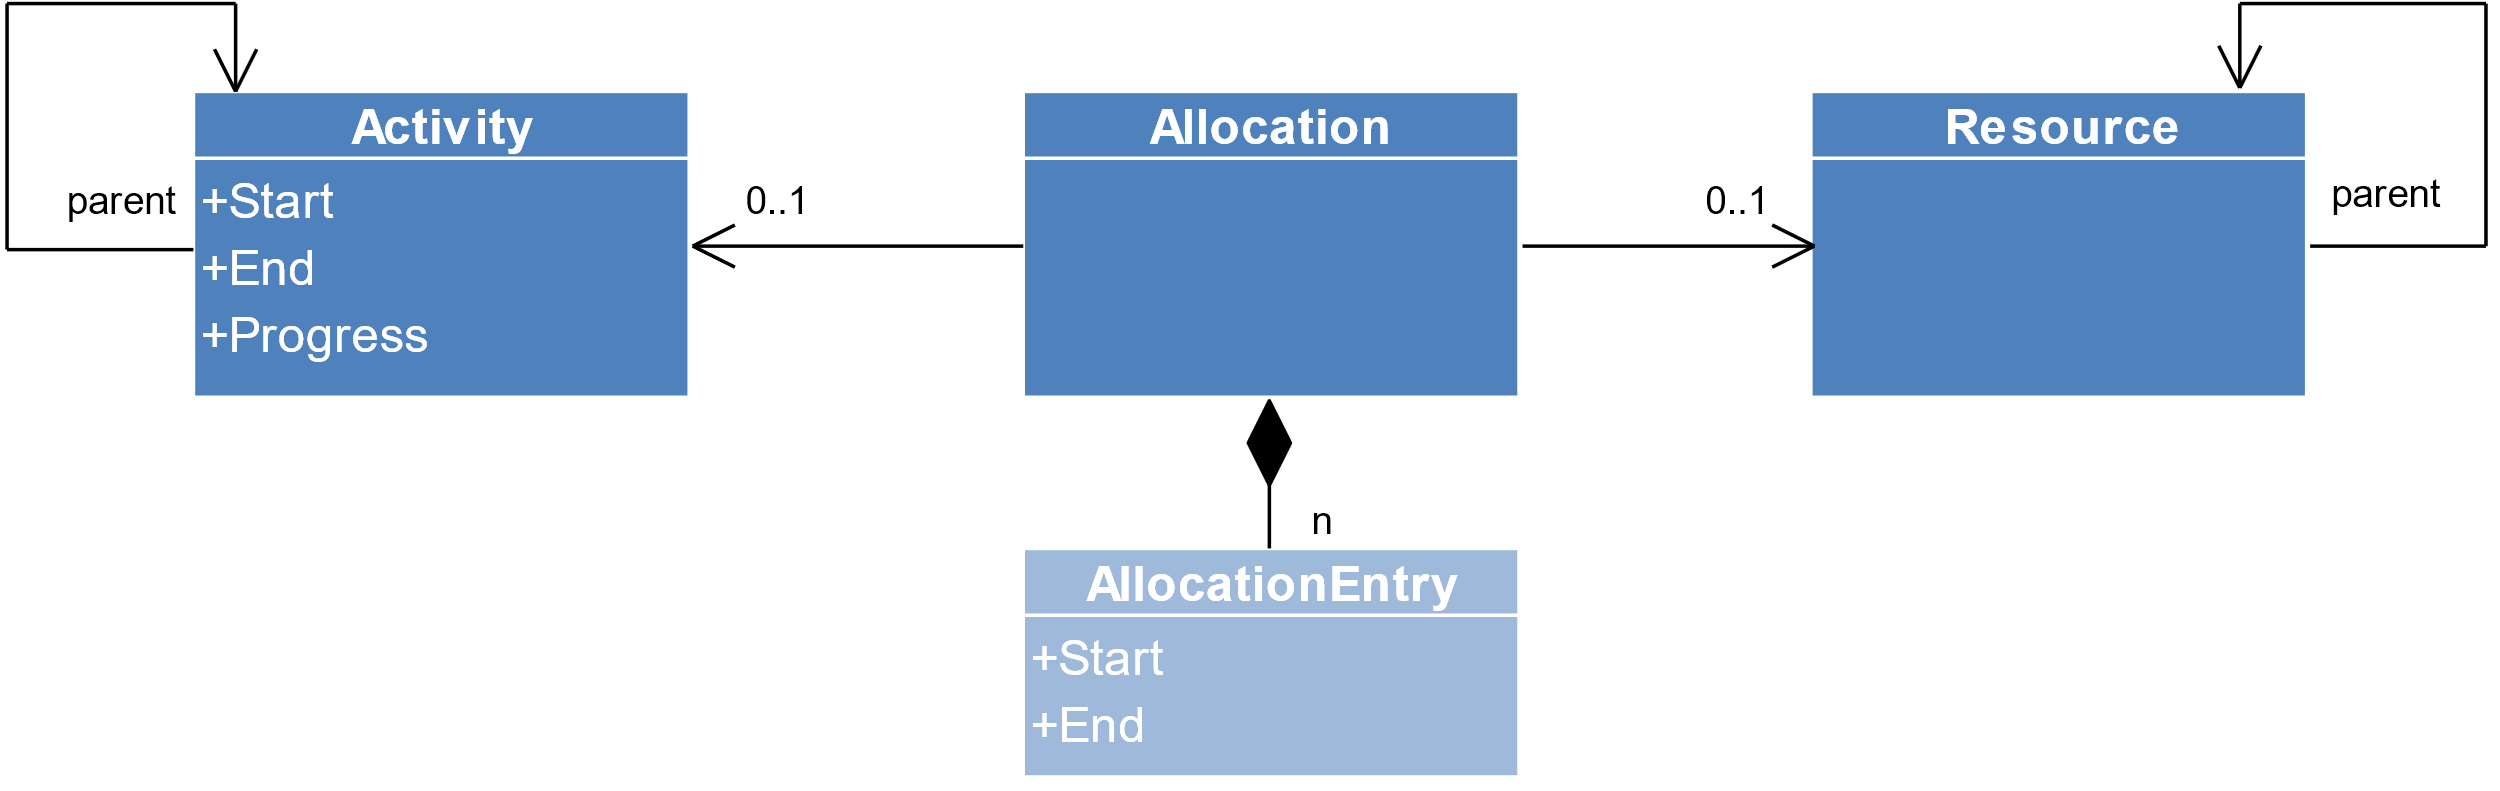
This simple part of the model enables us to map the majority of the situations that we – or rather our clients – are facing every day to our Visual Scheduling Widget:
- We can assign a resource to exactly one activity by using a single allocation.
- We can assign a resource to multiple activities by using multiple allocations.
- We can assign multiple resources to exactly one activity by using multiple allocations.
From theory to practice
Nothing can better support understanding than a little sample. Imagine, we have two drilling jobs and a drilling machine to perform such jobs. This means, we can represent this situation by a Gantt chart like this:
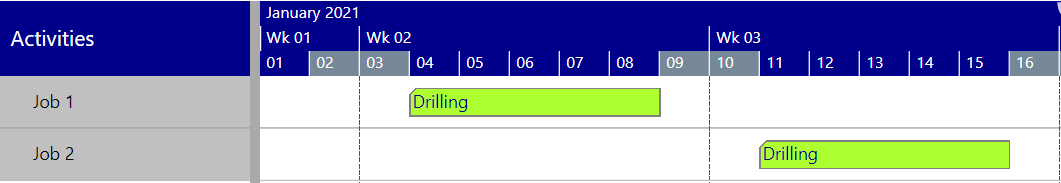
Our jobs are listed as activities in the table area, and the time schedule can be visualized by bars in the time area. In this case, our focus is on the activities. That is, we use the Activities View.
But we can also alter our point of view and focus on the resources:
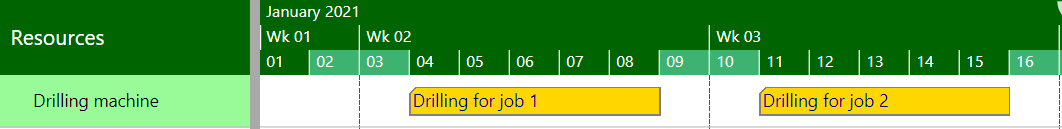
Now, this is the Resources View and the table area lists the resources instead of the activities.
Both views are something like the two sides of the same coin.
Resources View for more complex scheduling situations
What do we see in the time area of the Resources View? The activities? No, not at all! In the time area the allocations are displayed. That sounds strange, and in the simplest case where we have a one-to-one relationship between an activity and a resource, it does not matter whether we show activities or allocations, as long as the resource is assigned to the activity during the entire activity time.
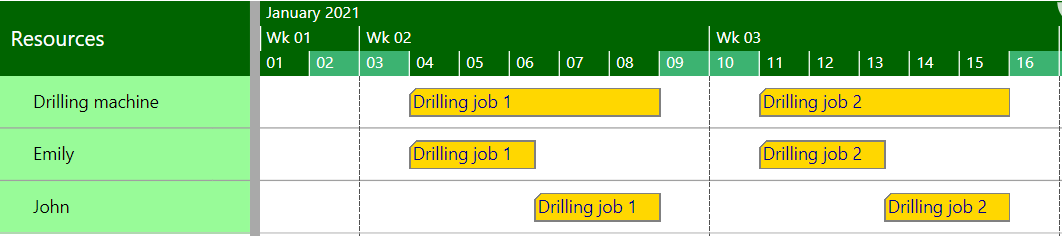
As soon as the reality becomes more complex, we benefit from the display of allocations inside the Resources View. Imagine, we need an operator in addition to the drilling machine for our drilling activities. We have Emily and John with the necessary skills, but Emily is only available for the first half of a week and John only for the second half of a week. This will lead us to a model with three allocations per activity. For this purpose, allocations can have defined start and end dates of their own, independent from the start and end dates of the associated activities. And while the Activities View remains as it is, the Resources View will change:
In summary:
- An Activities View lists activities inside the table and shows their position in time inside the time area.
- A Resources View lists resources inside the table and shows allocations inside the time area.
Pretty simple, isn’t it?
Characteristics of both view types
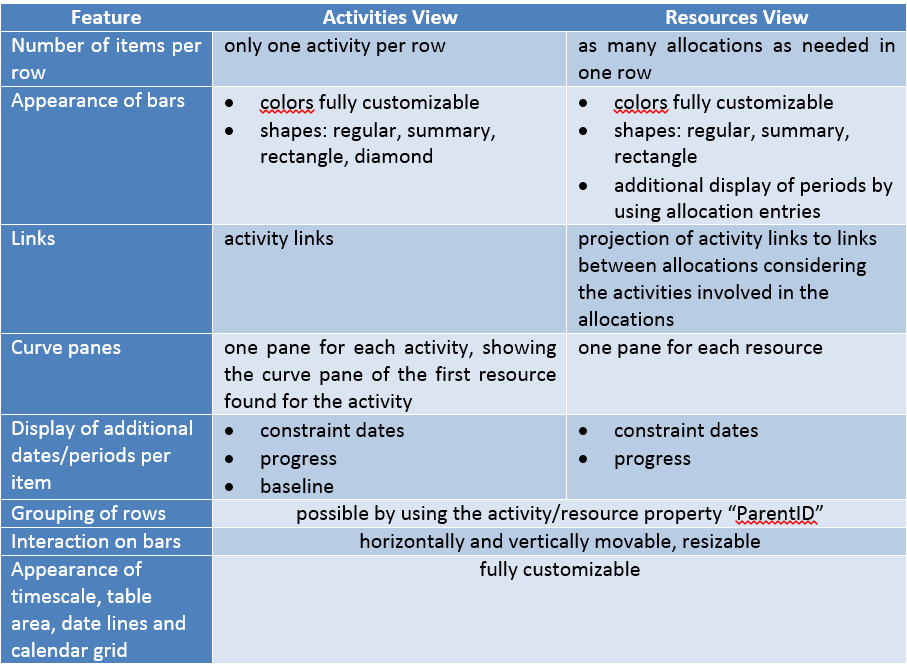
Now that the conceptual difference between both kind of views has been clarified, it is time to explain their main individual characteristics. The following table lists the main features and makes it easier for you to get an overview:
We also created a video about this topic. Here is the link to the video our YouTube channel.
What next?
Now you know about the conceptual difference between activities and resources view and how to build it with our Visual Scheduling Widgt, the next step is to create your own HTML5 Gantt chart. Here is a free trial version of the Visual Scheduling Widget, Standard Edition. Our support will be happy to assist you in case of any further question!
