
We at NETRONIC pursue the mission to empower every SMB organization to gain operational agility with visual scheduling. Visual scheduling is the effective management and change of time- and resource-oriented planning data which enables faster decision making, more reliable delivery time commitments, and a better use of resources. Consequently, we offer Gantt charts for visual scheduling. In that regard, customers often ask us what we mean exactly when we speak about a "Gantt chart scheduler" and for whom this tool is appropriate. This blog post provides an answer to this question.
The basic idea of a Gantt chart
If you want to put it into one phrase, the basic idea of a Gantt chart boils down to:
A picture is worth a thousand words
In essence, a Gantt chart visualizes (a lot of) complex time- and resource-oriented planning data in a most vivid way, and a Gantt chart scheduler helps to efficiently change these data by easy-to-understand drag & drop actions.
Initially, the major innovation of the Gantt chart was that it - for the first time ever - added a time element to the visualization of activities. So other than in any workflow or PERT chart, a Gantt diagram shows activities, their dependencies and their timing.
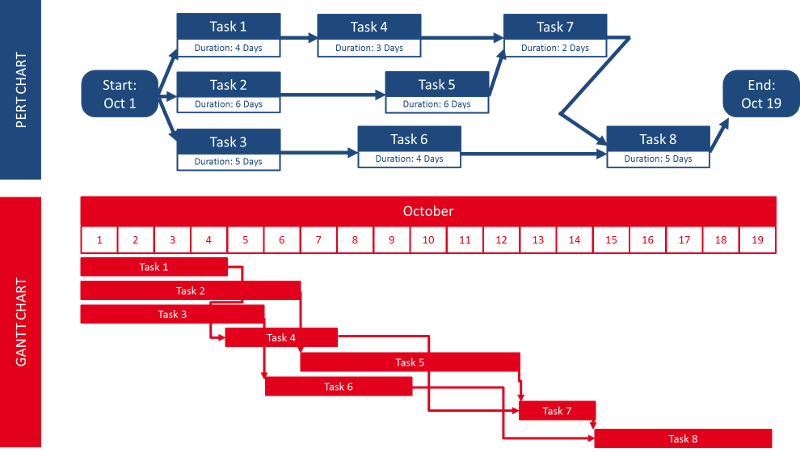
In the above example, you can see from the Gantt chart, that any delay in the tasks 2, 5, 7 and 8 will have an impact on the completion of the entire job. This kind of information cannot be seen (directly) from the PERT chart. With the advent of capable software solutions, another element - beyond activities, dependencies, and timing - exists in the Gantt chart. This is: resources.
As of today, the main purpose of the Gantt chart is to visualize activities, their timing, their dependencies, and the resources needed to perform these activities.
The evolution of the Gantt chart use cases
Often, Gantt charts are perceived solely as project management tools. In that context, they are often declared as outdated or even as "dead" (typically by folks trying to sell some kind of software or consulting services being based on a different approach ;-). The reason why they are often put into the pure project management category is obvious. They became popular while being used for project management challenges in highly visible projects like building the Hoover Dam.
Well, the truth is that initially Henry Gantt invented "his chart" to improve batch production in steel manufacturing. His idea was to achieve this improvement by making production processes and resource utilization visible. Interestingly enough, he worked with the following guiding question:
Which information does a foreman or supervisor need to quickly understand whether production is on schedule, ahead of time, or running late?
The key in answering this question was to use time and resource utilization (and no longer quantity) as yardstick for making scheduling decisions.
Due to their simplicity, the Gantt charts were then used for complex projects and their application shifted more and more from production to projects. This was accelerated with the advance of software solutions. As these software solutions merely were focused on project management tasks, the Gantt chart increasingly slumped into the project planning and into the project progress reporting "corner". Being in that corner, the Gantt chart evolution came to a (virtual) standstill.
Just in the past few years, Gantt charts seem to have been “re-activated” as a tool to help companies achieve operational agility. Their focus nowadays is much more on scheduling short-term activities and the concrete execution of a mid-term plan. As such, the areas in which Gantt charts are applied have been getting closer again to what this visualization technique initially was meant for. This is:
- proactive, visual scheduling
- rather than reactive reporting
Gaining operational agility with a Gantt chart scheduler
So today – with all the capabilities that software can deliver – Gantt charts are most effective, when they are used as scheduling tool to deliver operational agility. It is on purpose, that I use the phrase "scheduling" associated with Gantt charts rather than "planning".
Let's quickly recap the difference between planning and scheduling as both phrases often are perceived as being "kind of the same". A straight-forward take on this is:
- Planning defines what and how (and how much).
- Scheduling defines when and who.
Typically, planning happens before scheduling. It is, for example, to get an understanding of what should be produced, in which quantities, in which general time-frame, for which type of customers and at which quality level. It defines the desired outcome and a high-level road map to get there. Scheduling then breaks this down into concrete tasks with concrete times and owners (resources). It is deciding when and by whom the job is done and puts the plan into action.
Now that I distinguished scheduling from planning, it is time for another distinct differentiation.
Come on - another differentiation. Why that?
Well, my experience is that many folks talk about scheduling, but something like optimization in mind. Scheduling defines when and who. It is about sequencing, not about finding the "optimal" sequence. Period. [of course, there can be scheduling rules that get applied; but there should be no expectation that scheduling targets at building an "optimal plan"]
When it comes to Gantt charts, our experience tells us that they are a great tool to support scheduling (and that they are less cool for both planning and optimization).
So, what is the value of a Gantt chart scheduler defining the when and who?
The obvious value is the visualization. See above. A picture says more than a thousand words. This visualization in combination with any state-of-the-art software brings another value: the capability to quickly change the schedule while seeing how this impacts the schedule. The result:
- faster and yet more profound decision making
- capability to react to short-term incidents
- more reliable delivery time commitments
- better use of resource
We call this operational agility. In our experience, a Gantt chart - as long as it is used for scheduling (and neither for planning nor for optimization contexts) - delivers exactly this. Operational agility.
A word on manual vs. automatic scheduling
When it comes to scheduling and the role that software can play in scheduling, many folks have a kind of "magic button" in mind. A button that says "press me, and I will generate the best schedule for you." This boils down to the question if scheduling should be a manual or an automatically done exercise ... with the Gantt chart being put into the "manual corner" frequently.
Thinking about manual versus automatic scheduling quickly reveals pros and cons for both approaches:
- Manual scheduling has the advantage that a user is full in charge and fully understands what she is doing.
- Manual scheduling can become cumbersome when there are too many activities, too many constraints, and too many dependencies.
- This is when automatic scheduling kicks in.
- However (and obviously ;-), with automatic scheduling the user no longer understands what is happening and the software takes driver’s seat.
In this area of conflict, we recommend visual scheduling.
So, what's this?
This is Gantt chart-led scheduling, in which the user understands what is going on and in which the user triggers any change to the schedule by visual (drag & drop) actions in the Gantt chart.
Wait a minute! What happens when the user makes a visual change in the Gantt chart schedule?
This is a question of the design of the respective scheduling software application. This trigger can simply cause a manual change of the plan (1:1 as the user dragged & dropped) or this trigger can start an automatic scheduling run following certain defined rules.
The important thing is that the Gantt chart scheduler and the visual scheduling methodology keep the user in the driver’s seat.
So in essence, it is no big deal if the scheduling procedures happen purely manually or if there are some automatic scheduling rules being triggered by the Gantt chart interactions. However, there are scenarios in which the business logic is rather complicated and hence the required scheduling rule set becomes truly sophisticated. In these cases, a Gantt chart loses some value as proactive scheduling instrument and can be reduced to being a pure visualization/reporting tool.
The fact that these scenarios exist, then lead to the final question ...
Which customers should best work with a Gantt chart scheduler?
Let's recap what I discussed about a Gantt chart scheduler so far.
- It visualizes activities, their dependencies, their timing, and the resources needed to perform these activities.
- It should be software-based.
- As a scheduling tool it deals with the when and how (rather than with the what and how, which would be planning).
- Scheduling does not mean optimization.
- It yields operational agility.
- It puts the user in the driver's seat and can be both purely manual and work as the visual interface for some programmatic scheduling rules.
Overall, the approach is rather hands-on and entirely lacks the elements of both strategic planning and sophisticated optimization. As such, it resonates better with small and mediums-sized businesses (SMB) rather than with large enterprises.
Within the SMB customers, a Gantt chart scheduling software has been proven as a truly valuable tool for those organizations who have a need to gain fast and clear answers to the when and how. The "when" (and the scheduling purpose of sequencing) clearly puts the timing into the foreground, which means that visual scheduling is especially valuable for customers with a given set of customer orders of which the delivery time is crucial. This is especially (but not exclusively) true for
- Make-to-order manufacturers
- (Small) engineering-to-order companies
- Field service-driven organizations with rigid SLAs
Many of these SMB companies already work with an ERP or business management system that fits well with their processes. Often, these systems lack proper Gantt chart scheduling capabilities. This is - for example - true for both Microsoft Dynamics NAV and Microsoft Dynamics 365 Business Central. Here is some in-depth content for partners who look for Dynamics 365 Business Central and Dynamics NAV Gantt chart visual scheduling.