Sticking to our promise of providing new releases every month, we came up with releases of the VPS (and, of course, the Visual Jobs Scheduler) in July and in August. Due to the summer holidays, there was no special blog about the July release, so that today I'll give you the tour of both VPS releases. The VJS will follow next week.
So sit back and enjoy the powerful new features we've implemented for you during the last two months.
#1 Show a progress bar
This is the major new feature that came with the July release of the VPS.
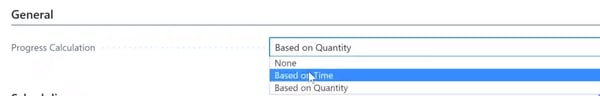
You can now decide whether to display a progress bar for production order routing lines of released production orders. For this, we implemented a new option in the "Setup dialog" where you can select whether to show a progress bar at all or one by quantity or by time.
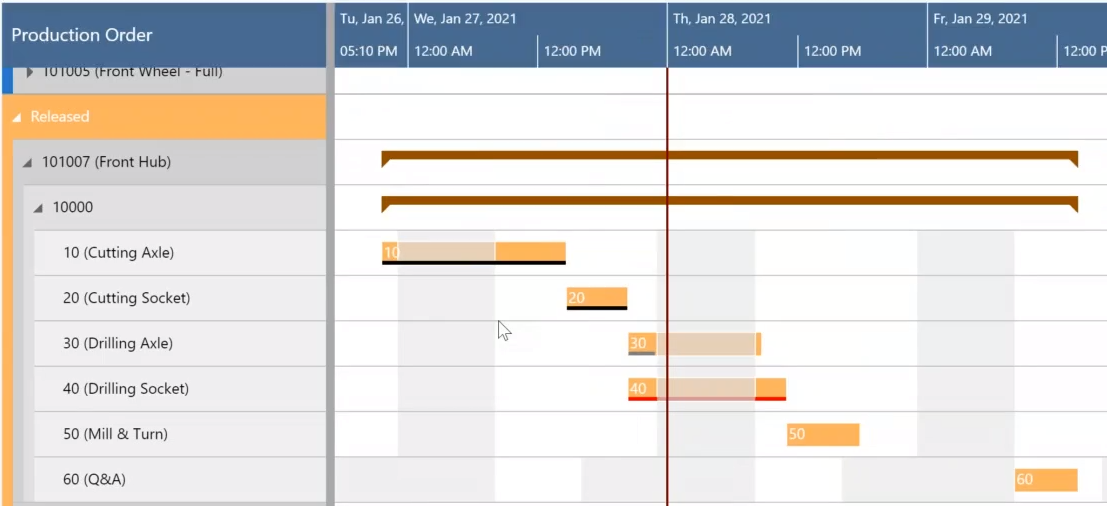
The color of the progress bar depends on the routing status and the percentage of completion:
- Status “finished”: black
- Status “none”, “planned”, “in progress”:
- Progress by quantity / by time < 100% : grey
- Progress by quantity / by time (i.e. you have posted more than initially planned) > 100 % : red
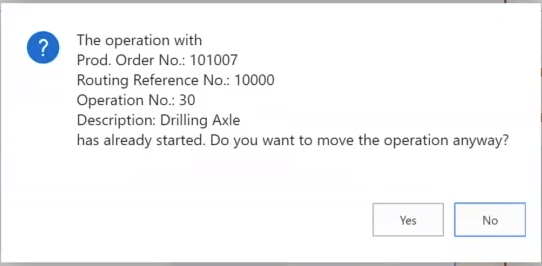
When you have switched on "Automatic scheduling of predecessor" and/or "successor" the operation's routing status is being taken into account, so that if you want to move an operation that's in progress or whose predecessor/successor is in progress, you'll receive a warning message and can cancel or continue your action:
#2 Visualize the setup times
One of the new features of the August release has its origin in customer feedback we got for the .NET add-in and applies to the Capacity View. People kept telling us that rather than the wait time, the setup time was really relevant to them and that they wanted to see it at a glance.
Their wish was our command and we now offer a context menu for showing or hiding the setup times at the bar.
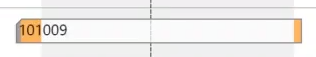
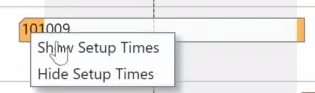 The setup times are visualized as grey section at the beginning of the bar:
#3 Show/hide non-working periods
This feature was already part of the .NET VPS and we have now added it to the D365 BC app.
Some planning situations require to focus on the working periods of a work or machine center only. If so, click the new "Calendar" item in the "Actions" menu and select the desired option:
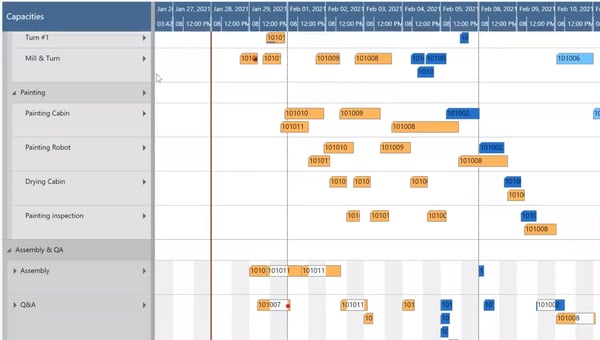
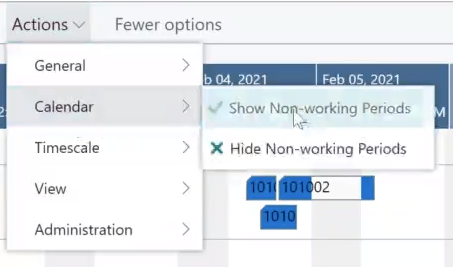 After having selected "Hide non-working periods", you'll only see the non-working periods that are unique to some work and machine centers.
#4 New data filter
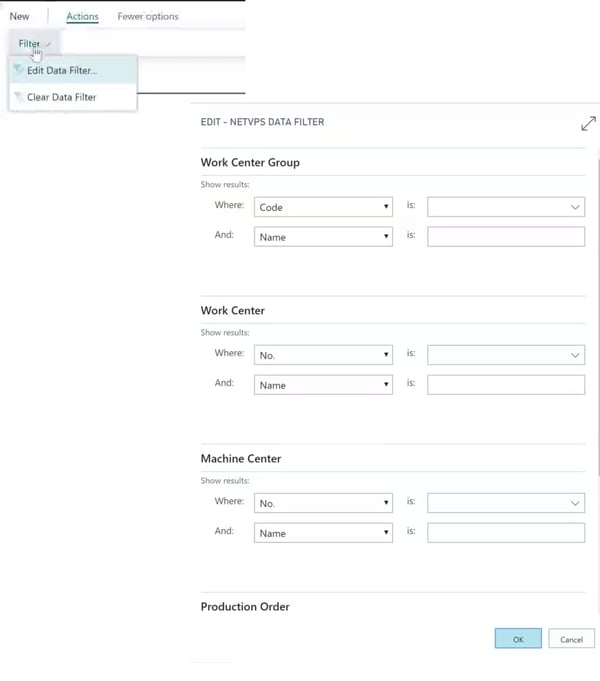
The VPS now offers a data filter that applies already at the data interface so that the amount of loaded data will be reduced. To specify the filter settings, open the new "Edit data filter" dialog that can be reached from the "Setup" dialog:
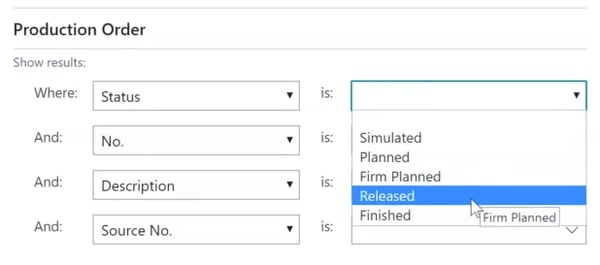
If, for instance, you want to see released production orders only, enter the according criterion:
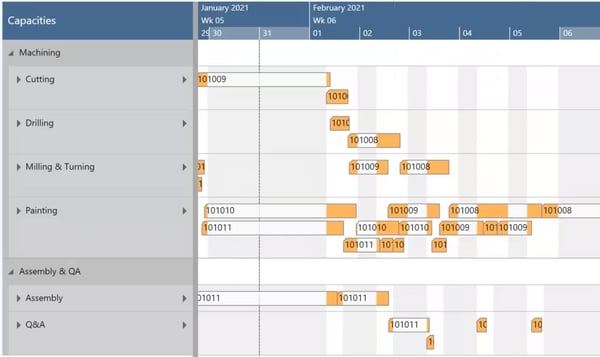
After having confirmed your choice and having reloaded the data, the result will be as shown below:
Impressed? Then look forward to my next week's blog where I'll present you with the new features of the VJS for Dynamics 365 Business Central.
More information
- Watch a video presenting the new VPS features in a nutshell.
- Watch a recorded webinar about the Visual Production Scheduler or sign up for an upcoming one.
- Browse our knowledge base.
- Download our ebook about visual scheduling for Microsoft Dynamics NAV: