There seems to be one unspoken reality when it comes to production scheduling: No matter which system you use, and how accurately your data are, and how much you have spent in sophisticated scheduling algorithms, production reality never follows your system's implicit or explicit model. Hence, users of any production scheduling system should not only look at how it deals with a typical or an average production schedule, but they should also ask how the system supports them when dealing with unplanned incidents.
This blog post addresses manufacturing users of Microsoft Dynamics NAV and provides them with a Dynamics NAV tip (including tutorial video) on how to deal with short-term deviations from the planned capacity (i.e. when a machine operator calls in sick for a shift, or when a machine breaks down).
So, here is a typical question that we frequently hear from Microsoft Dynamics NAV users: We produce parts to stock rather than for direct delivery to customers and we have a machine operator per shift running a number of automated machines. If the machine operator takes sick leave for one shift, obviously, the current production orders will be delayed by one shift as will all the production orders that have been planned in the future. How to handle this best when working with Dynamics NAV and how to understand the impact of this change at one glance?
Approach: standard NAV & visual scheduling add-in
Of course, any of the above can be achieved with standard Microsoft Dynamics NAV functionality and does not require any non-standard enhancement. If there is one thing missing in NAV, it is the capability to visually represent the production schedule in an interactive Gantt chart. This functionality can get provided by the Gantt chart add-in called Visual Production Scheduler, which is a visual and interactive frontend to standard NAV manufacturing.
Step 1: registering absence
The first step to take is to register absence at the respective work or machine center for the respective date and time. As the Visual Production Scheduler is a fully integrated add-in Dynamics NAV solution, there are many shortcuts from the Gantt chart add-in to standard NAV functionality. In our case, just double-click on the machine center name (here: Linda Mitchell) to open the machine center card. Now click register absence and type in the respective date and time. Don't forget to click update before you actually close the page.

Step 2: re-plan production order
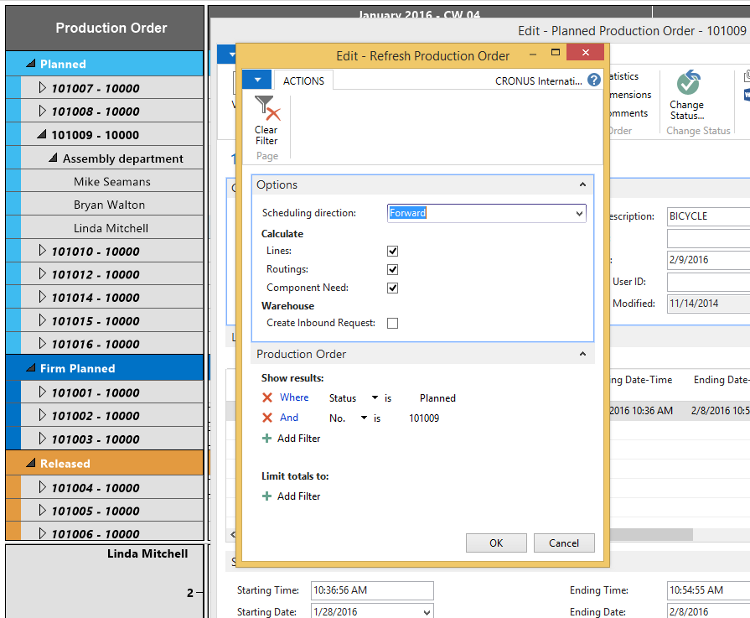
With registering absence, you changed the capacity table for that machine center in the NAV database. Hence, as second step you want to automatically re-plan the affected production order accordingly using standard NAV functionality. Again, there is a close link between the Visual Production Scheduler and the required NAV dialogue. Double-click the production order to open the according production order card. Now click refresh production order. As you want to see the impact of this absence for the subsequent operations and leave the previous operations unchanged, you need to select scheduling directions: forward. Then click OK and confirm.
Step 3: understand implications from the visual production schedule
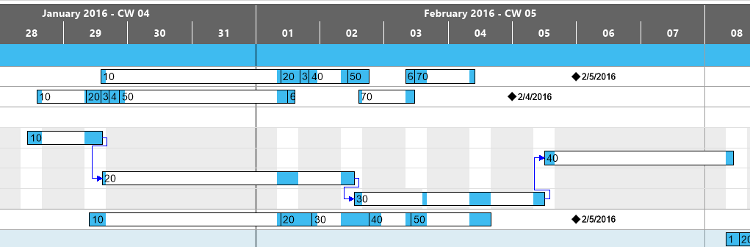
Now, as third and final step, you need to refresh the Visual Production Scheduler to push the changes made into the visual front end. Now you see the additional non-working time from the grey area in the background of the respective machine center. Likewise, you notice that due to the longer non-working time, the bar that represents operation 30 in the Gantt chart has become longer, which means that the operation will take longer to complete. You also see that the following operation has been pushed out and now no longer finishes on the same day it did before we registered the absence to the machine center.
For your reference, this is how the schedule looked before we applied steps 1 to 3.

Of course, now the changed capacity availability for machine center Linda Mitchell gets taken into account when moving other production orders or operations.
Want to see this step-by-step Dynamics NAV tip in action? Have a look at the video tutorial:
Your next steps
Curious to learn more about the idea of enhancing standard Microsoft Dynamics NAV with visual scheduling functions? Download and read our complementary ebook for Dynamics NAV users and customers: