The modern look & feel of Gantt charts not only helps gaining user acceptance. A well-thought-out design also yields intuitiveness and user friendliness. So, when developing a Gantt chart one should not only keep an eye on functionality but on design as well.
Of course, every Gantt chart has to meet its own planning requirements and hence has to have its own look. Even though, there are some basic design considerations a developer should keep in mind when developing a Gantt chart.
Ok, so here we go with three more tips:
#1 Additional Details at the Right Places
Specific information such as start, end, and duration of the visualization bars help to visualize the entire activity, although the user often requires additional information from the planning schedule and activities to complete the circle of information. It can often pay off to consider in which situations, and in which contexts, certain information are relevant to the user.
Your basic options include:
- Additional details placed in the bars.
- Setting up a Tooltip.
- Expanding the table area.
Keep in mind that these changes are context driven and you will not need to make them everywhere, every time.
1. Bars
The information which is added is naturally dependent on the situation. When the details are dependent on time, for example, the information regarding whether an operation will be delayed or about a task’s degree of progress , should be represented in the bar area.
2. Tool tip
A Tool-Tip-Text can often be helpful when complex or comprehensive details are necessary this special activity.
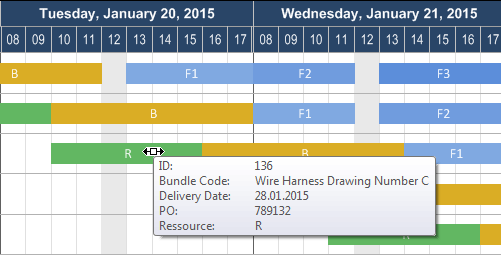
Format the Tooltip-Text as a table so that it is more easily read.
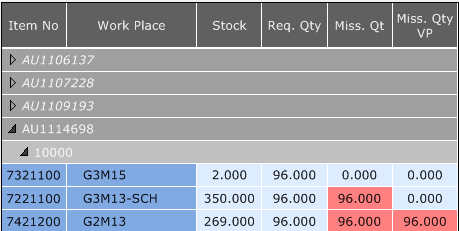
3. Table
Information which is either of more general interest, or independent of the visible time area, should be placed in the table.
#2 Choice of Time Scale
Select a time scale solution which is most appropriate to your planning horizon. For example, a project planner, who manages long-term projects, will select a time scale showing months and days.

On the other hand, a production planner who is planning his weekly orders, will most likely benefit from a time scale showing days and hours, potentially even as granular as to the minute.

If your planning applications require an expanded time horizon, you will need to adjust the date formats, so that they – depending on the solution – will switch dynamically to small or large unities (read also our blog post). Now we can see that it will be possible to have a continuous in-out zoom in the planning. You can limit the dynamics by setting a minimum and maximum solution to prevent the planner from offering solutions that don’t make sense to the user. For example, a user who plans in days does not require a time scale in seconds.
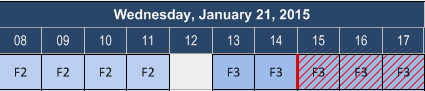
#3 Visual Warnings
A delivery is in danger of being delayed, or a capacity is overloaded in a given period: these conflicts are signaled with the help of a visual aid. When developing a Gantt chart, you must not only consider how a visual warning will look, but also where you’re going to want it displayed. In general, the affected bar is marked with a red line or the change of its bar color when exceeding the deadline. If many processes are displayed one below the other, it is often helpful, that you also reflect the warning at the top level, or incorporate a field for the warning in the table area.
Example: Warnings indicating that the activity will finish after the required due date...

are also displayed at the topmost level …

...so that, also in the collapsed view, the planner can recognize that exceeding the due date is imminent.
Your next step
Want to learn more tips for user-friendly Gantt charts? Download our free Ebook now!