
A new version (5.1) of VARCHART XGantt, our Gantt control for creating powerful Gantt charts, has been released recently. You can find the complete release notes here.
We’ve come up with so much new features that introducing them all at once would go beyond the scope of one blog post. So I decided to split my description of what's new in the Gantt chart control into a series of blog posts, the first dealing with some great new graphical features.
New sash attributes
Three new layout options allow to modify the appearance of the sashes separating table and diagram as well as histogram and diagram:
- The three-dimensional appearance can be switched on or off:
 |
with three-dimensional effect |
 |
without three-dimensional effect |
- The sash width can be set to a value between 3 and 20 pixels:
 |
3 pixels |
 |
20 pixels |
- The moving phantom of the sash can appear as double line when the update behavior is switched to „Standard“.
 |
with double line |
 |
without double line |
Auxiliary lines for modifying nodes
When nodes are being moved, extended or shortened, you can now show auxiliary lines:
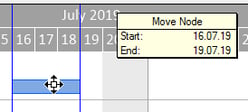 |
When the mouse pointer is above a node, the auxiliary lines are being shown upon pressing the left mouse button and vanish again when the button is released. While a node is being modified, the auxiliary lines will be constantly updated, of course. |
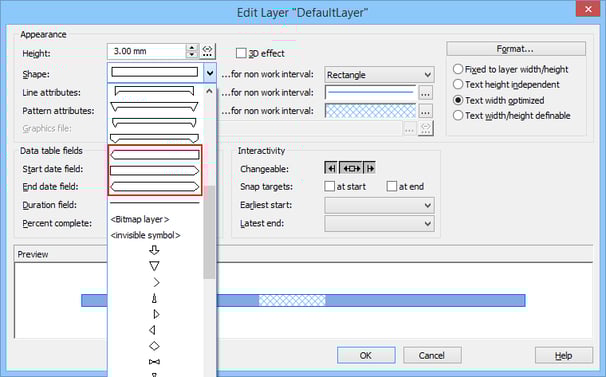
New layout attributes for the layers in work free intervals
We have re-designed the Edit Layer dialog and have added layout options for layers in work free intervals.
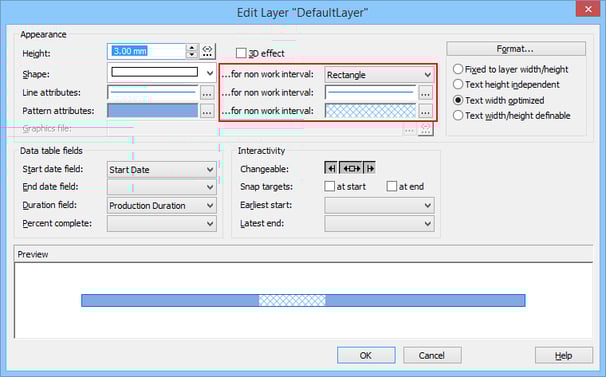
The new layout options in detail:
| Line: Select the line attributes | |
| Rectangle: Select a pattern for the work free interval. | |
| Free area | |
| None: Use this option if only the work free intervals of one particular layer are to be hidden, although on the Nodes property page the „Show work free periods of nodes“ option has been ticked. |
New layer forms
Three new layer forms were added:
![]()
![]()
![]()
These layer shapes can also be selected in the re-designed Edit Layer dialog:
Next steps
Now try by yourself. If you do not use VARCHART XGantt so far, feel free to download a trial version. This version comes with full functionality, and we are happy to provide you with free tech support during your 30-days trial period.
Want to get more detailed information on selected VARCHART XGantt features? Read our blogpost on how to customize the display of the duration in the tooltip.