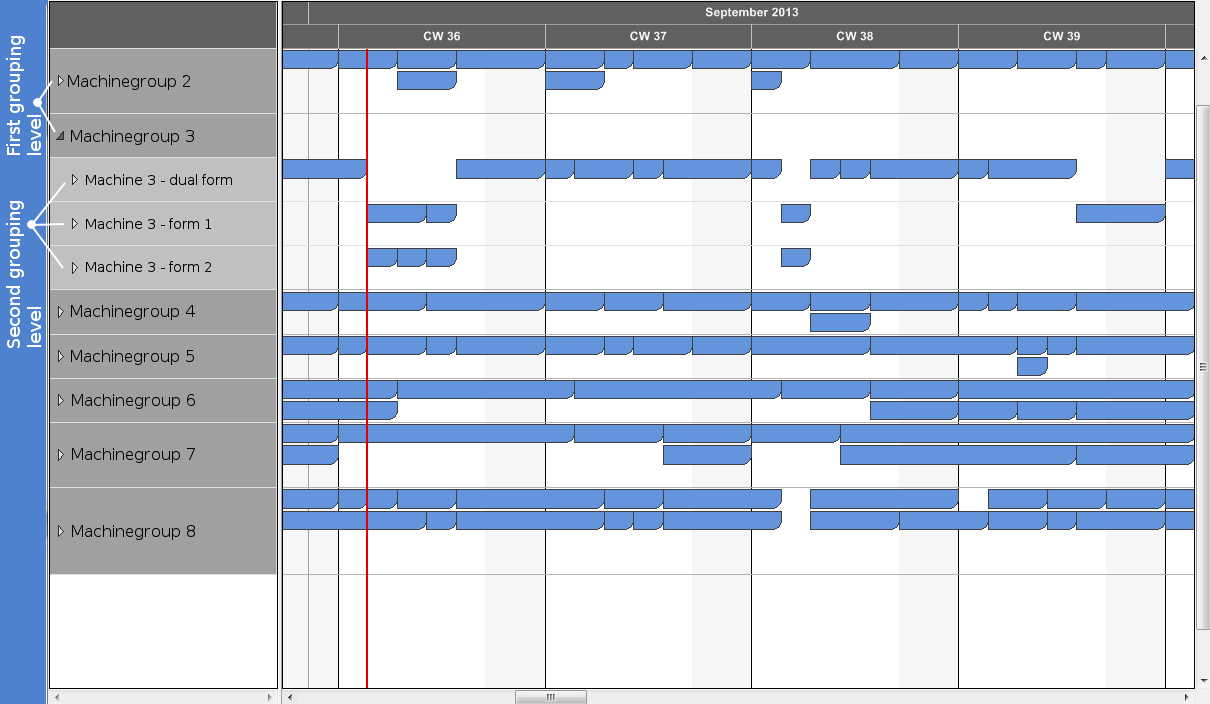
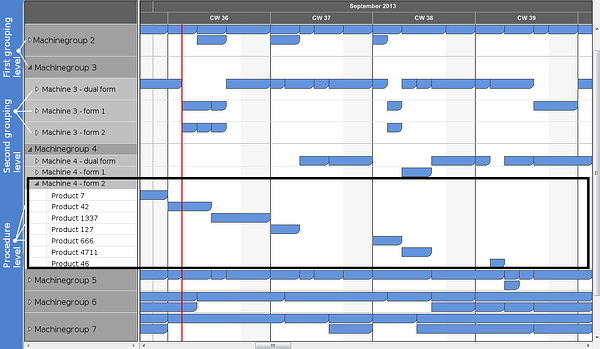
In Gantt charts activities are often displayed in groups. This is done, for instance, in a "machine Gantt" which visualizes the machine load, and which differentiates machine groups and the respective machines. This is called double-staged grouping.
Groups in Gantt charts imply expanding and collapsing, depending on whether one wants to view the planning data in a broader perspective or in detail.
And this is exactly where conventional Gantt controls face issues: Normally, nodes are only displayed on one group level. How is it possible then to display nodes in a Gantt chart group either collapsed at the top level or expanded at the lowest level?
This new post from our Gantt tips and tricks blog series explains how you can visualize the nodes on the group level you want and how an individual group based arrangement of nodes enhances the information value of the Gantt chart representing your planning data.
The VARCHART XGantt “shifting” trick
VARCHART XGantt is a very flexible .NET Gantt control that can be tailored to nearly every visualization requirement with respect to time-oriented planning data by only small programming additions. We proceed as follows to gain a simultaneous view of activities at different grouping levels:
Upon start, the machine Gantt chart appears collapsed. The below sample hence displays the machine groups, whereas the single machines are not shown initially. Thus all nodes are displayed at the top level.
After having expanded the machine group, the second level - the individual machines - appear. Now, we visually shift the nodes (see 'how to instruction' at the end of the blog post) from the machine group to the machines. When collapsing the first level again, we simply undo the shifting and the nodes again appear on the first level.

The screenshot shows that we even combine the visualization of the nodes in the different groups and at the same time display them at different levels. So machine group 2 displays the nodes at top level, machine group 3 at the second level. The nodes’ visualization settings can be made individually per group per level in VARCHART XGantt.
Our Tip: Optimized arrangement of nodes in one row
To arrange the nodes at level 1 and 2 we have selected the VARCHART XGantt mode “all nodes in one row” simultaneously with the “nodes optimized” option. With this, the following is achieved: (a) All nodes are shown in one row next to each other so that you can see the machine utilization at one glance. (b) If nodes overlap, an additional row is shown and the overlapping nodes appear in the new row.

Change the node arrangement when the 2nd level is expanded
As we want to provide the planer with the option to get an as detailed as possible view, we have changed the “all nodes in one row” to “nodes in separate rows “ by ticking the respective check box for the second grouping level. On expanding the machine view, every node will be clearly arranged in a row of its own so that the planner recognizes the exact timing of the activities.
In addition the activities are sorted by start date so the planner can easily find the very next planned activity immediately. (btw: more tricks on how to sort data in VARCHART XGantt have been published recently)

„How to“ for this node arrangement in the grouping view with VARCHART XGantt
Step 1
Please note: We don’t use extended data tables in this example. In our traditional data structures groups are created automatically by the grouping criteria of the nodes.
Settings on the VARCHART XGantt property pages:
We need at least three grouping fields in the data definition of the nodes.
- Group name for the first grouping level
- Group name for the second grouping level
- Dummy grouping data field
The “Shifting” trick: If you leave the second grouping field empty, e.g. by an empty string, VARCHART XGantt sorts the respective node to the group at the next highest level. Don’t simply replace the grouping name of the second level by an empty string because then the value will be definitely deleted and can’t be assigned any more. This is why we need the dummy data field that either an empty string or the grouping name of the second level will be copied into when needed. Initially, the dummy data field will be left empty.
Step 2
Next, if not yet specified, we create a GroupLevelLayout for each of the two grouping levels.
Settings needed:
- 1sr level grouping by: Your grouping field
- 2nd level gouping by: dummy data field
- Nodes in separate rows :false
- Nodes optimized: true
- Groups collapsed: true
Step 3
Now the VARCHART XGantt configuration file has to be exported, edited with a text editor and then imported again.
The exported INI file shows the "CreateGroupForEmptyEntry" key for each grouping level ([GroupingLevel_X]). To simplify matters, this key has to be set from “YES” to “NO” for all existing grouping levels. Don’t forget to set this key again for all grouping levels being added later.
Step 4
Needed source code:
As first step, we need to check which grouping level triggered the Modified event.
If the first level (0) is collapsed or expanded, we have to create the second level and shift the nodes by a foreach loop.
If the second level (1) is collapsed or expanded, we have to switch between single-line or multi-line view.
private void vcGantt1_VcGroupModified(object sender, VcGroupModifiedEventArgs e)
    {
vcGantt1.SuspendUpdate(true); if (e.Group.GroupingLevel == 0) { if (e.Group.Collapsed) { foreach (VcNode node in e.Group.NodeCollection) { node.set_DataField(DT.Maindata_GroupLvl2FieldIndex, ""); node.Update(); e.Group.NodesOptimized = true; e.Group.Update(); } } else { foreach (VcNode node in e.Group.NodeCollection) { node.set_DataField(DT.Maindata_GroupLvl2FieldIndex, node.get_DataField(DT.Maindata_GroupLvl2DummyFieldIndex)); node.Update(); } } }if (e.Group.GroupingLevel == 1) { if (e.Group.Collapsed) { e.Group.NodesArrangedInOneRow = true; e.Group.NodesOptimized = true; e.Group.Update(); } else { e.Group.NodesArrangedInOneRow = false; e.Group.Update(); } } vcGantt1.SuspendUpdate(false);}
What kind of VARCHART XGantt tips and tricks do you have? What challenges do you have that we could cover in one of our next blog posts? Please share with us in the comments section.
Not yet using VARCHART XGantt? Get started with your trial today:


