Create a System.Windows.Forms.Timerobject that executes the following code on each Tick event:
DateTime leftDate = DateTime.MinValue;
DateTime rightDate = DateTime.MinValue;

VcDateLine dl1 = vcGantt1.DateLineCollection.DateLineByName("DateLine_1-1");
vcGantt1.GetCurrentViewDates(ref leftDate, ref rightDate);

if (vcGantt1.TimeScaleEnd <= rightDate.AddMinutes(2))
{
     vcGantt1.TimeScaleEnd = vcGantt1.TimeScaleEnd.AddHours(1);
}

DateTime newLeftDate = leftDate.AddHours(1);
DateTime newDateLineDate = dl1.Date.AddHours(1);

dl1.Visible = false;
vcGantt1.ScrollToDate(newLeftDate, VcHorizontalAlignment.vcLeftAligned, 0);

dl1.Date = newDateLineDate;

dl1.Visible = true;
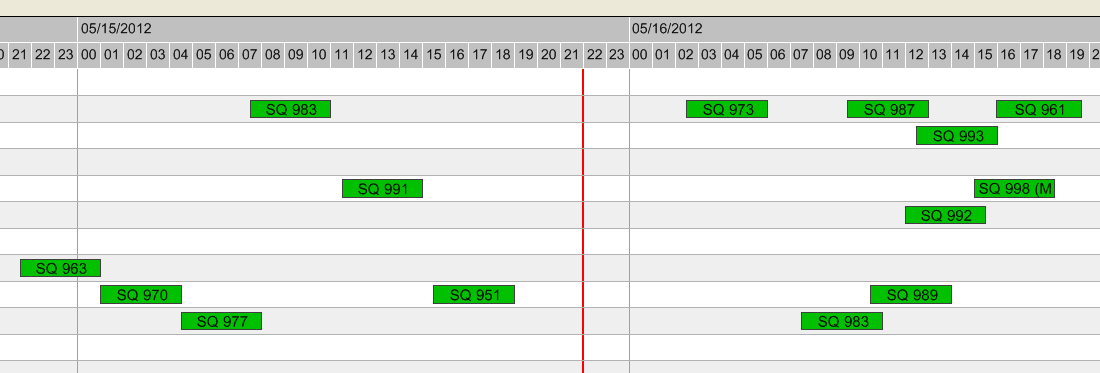
This code will cause the time scale to shift to the next hour on each Tick event. The temporal position of the date line can be set at design time on the XGantt property pages or with the VcDateLine.Date property when starting the program.
This tip gave you an idea of how to quickly and simply improve the interaction experience in your Gantt chart. Interested in more tips and tricks? Find this and 10 more best practice Gantt visualization tips put together in an ebook that you can download for free!