Bottlenecks are common occurrences that happen in any industry that work with limited capacity. In general, the existence of bottlenecks could lead to stalls in production, supply overstock, issues with customers and issues with employees. This blog post shows how visual scheduling can help you identify bottlenecks in production when you work with Microsoft Dynamics 365 Business Central.
General observations on bottlenecks

Here’s a simple example of an everyday bottleneck. It is an image of a typical traffic jam from my hometown in Manila, Philippines (this is one thing that I do not miss from back home 😊).
You can clearly see the bottleneck on the bus lane and the adjacent lane, which is not present on the other lanes. The bottleneck caused a traffic jam or a stall in movement from the cars on that lane. We know there are a lot of things wrong with this picture, but simply put, some problems we could identify are the following:
- There are not enough roads in this part of town
- There are too many cars that ply these roads
- There is no balance in the distribution of cars and roads in this area.
Now let’s shift our focus to manufacturing, where the term bottleneck is widely used.
It usually describes a point of congestion in a production system and somewhat highlights an inefficiency in the system. Effectively dealing with bottlenecks is vital for every organization as it helps them achieve efficiency, increase the throughput and, in the end, a better bottom-line.
The most obvious way to deal with bottlenecks is to identify them. And the best way to do that, would be to visualize them. Visualizing the bottlenecks makes it easier to see wait times, backlogged work and the resource causing the bottleneck. Once this information is available, it would be easier to shift work around by reschedule them or reassigning them to different resources.
Identifying bottlenecks with standard Business Central
Working with bottlenecks in Microsoft Dynamics 365 Business Central this is not easy. If you work with standard BC, then you already know that this is quite complicated. Since you do not have any visualization, as you only have tables, it is quite hard to draw conclusions by the data on the tables. You would need to really read between the lines, and in order to do that, you would need to know the following:
- Manufacturing module
- The due dates of all your production orders (from all production order types) and production order lines if applicable
- The start and end dates of each production order routing line
- The capacity of your work center/machine center and to which production order routing line they are assigned to
- Job module
- The due dates of your Jobs and job tasks
- Start and end dates of each of your job planning lines
- The capacity of your resource and to which job planning line they are assigned to
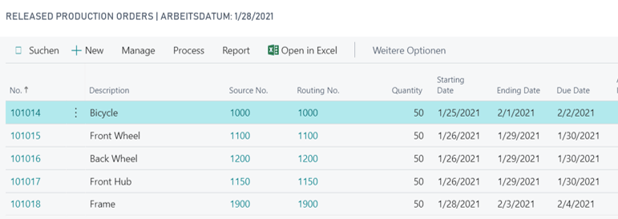
In the released production order table from the manufacturing module, I can see my released production orders, but not my other production orders with different statuses. It also does not give me a detailed visual of the different production order routing lines that make up my production orders. Therefore, it does not give me the whole picture of a schedule.
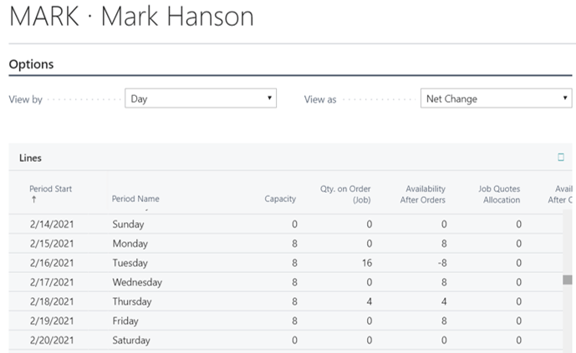
Here is what the resource card looks like on the job module. This is an example of one employee’s availability – Mark Hanson. Working with tables gives you a lot of detail for a certain resource or order, but it does not help you understand the big picture as I cannot compare what Mark is doing to what his colleagues from the same department are doing.
Managing bottlenecks with Business Central + visual scheduling
Option 1: Histogram / capacity load chart (VPS and VJS)
In terms of visualizing the data required, nothing gets the job done better than a Gantt chart, ideally complemented by a histogram (capacity load chart). With several different views it is possible to visualize all the data you need and stay on top of your orders and resources.
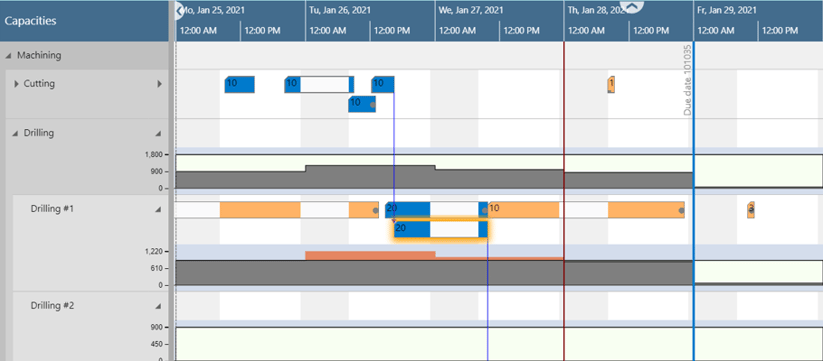 The image above shows you how you can visualize your bottlenecks on Business Central's manufacturing module with the Visual Production Scheduler (VPS) (we also have the Visual Job Scheduler (VJS) for the job module). You will see all your machine centers in one view, and whether and how they capacity is utilized on specific days or not. If they are preoccupied, then it is easy to trace, as to which operation the resources are busy with. On the image above you can see that the Drilling #1 machine center has a full week and if I wanted to schedule my operation 20 before its due date, I would need to do one of the following:
- Reschedule some of my planned operations to make way for operation 20
- We could also take into consideration Drilling #2, and if it is capable of taking some of the workload from Drilling #1. If that were the case then we can simply reschedule operation 20 to Drilling #2
The VPS does not only give you a better overview, but you are also able to make drag and drop changes to the data on the Gantt chart.
Option 2: Dedicated color scheme (VAPS)
We have gone even a step further in our new product, the Visual Advanced Production Scheduler (VAPS). We have the functionality to view wait times, which let’s you even have a better understanding of your bottlenecks. With wait times we refer to the time that a successor has to wait on a certain machine after the finish of its predecessor because the machine is scheduled to work on other operations first.
By using different colors, we help customers visualize whether their operations can start right after their previous operation or if they would need to wait. We also make it easy to see whether or not because of waiting, the production order misses its due date.
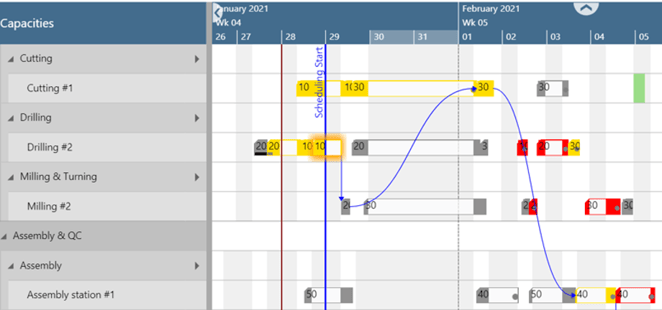
Using the wait time view I can easily see the operations that do not start right after their preceding operation ends. This is shown in a yellow color. You can see clearly that my operation 30 does not start right after my operation 20, because the machine center is busy with another operation. The same happens to operation 40. Operation 20 starts right after my operation 10, thus its color is different (grey). 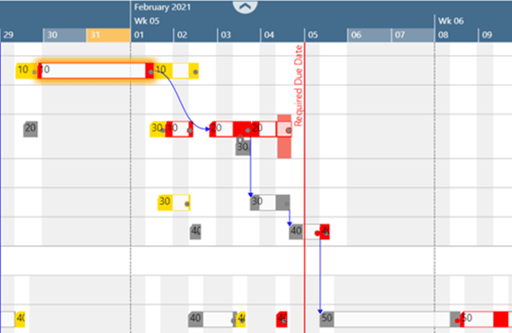
Here I see how my wait time on my bottleneck actually leads to a missed due date. I see that my operation 40 and 50 do not finish before the due date, thus my whole production order will be delayed. The wait time view shows that the cause of the delay are actually my operations 10 and 20, and you that they are in color red here.
Bottlenecks are something that our visual scheduling extensions were made to solve.
We help identify and visualize bottlenecks and give you several tools to help you deal with them. We have products for both the manufacturing and job modules of Business Central.
If you want to learn more about visual scheduling, download our free Ebook introduction to visual scheduling for Microsoft Dynamics 365 Business Central.