Gantt charts are used frequently to visualize and manage resource utilization and capacity load in production scheduling applications. Ideally, this is achieved by complementing the Gantt diagram with a histogram. However, when moving a bar the user always has to observe two moving elements on the screen in parallel: the bar and the histogram. Sometimes, this feels as difficult as determining an offside postion when playing football. With VARCHART XGantt 5, we provide .NET Gantt chart developers with the capability to also show resource overloads in the respective diagram row. This blog post is a step-by-step guide how to achieve this.
We want to achieve that overload ranges in a Gantt chart that is grouped by resources, each with its capacity load being shown in a histogram of its own, are not only displayed in the histogram but also directly at the node when the mouse cursor points to this node.

The following settings are needed to achieve this:
1. The present example features the resources A and B with their respective group calendars that both have the same name. Create an overload calendar for each calendar and name them A_Overload and B_Overload accordingly. The calendars have to be empty, meaning that they must not contain intervals or profiles.

2. Specify these calendars as Overload Results Calendar in the capacity curve of each histogram.

3. Create a mapping table to assign the overload calendars to the resource names (i.e. the contents of the grouping data field).

4. In the Node area of the Grouping dialog create the new calendar grid OverloadGrid, and tick the Calendar grids visible box.

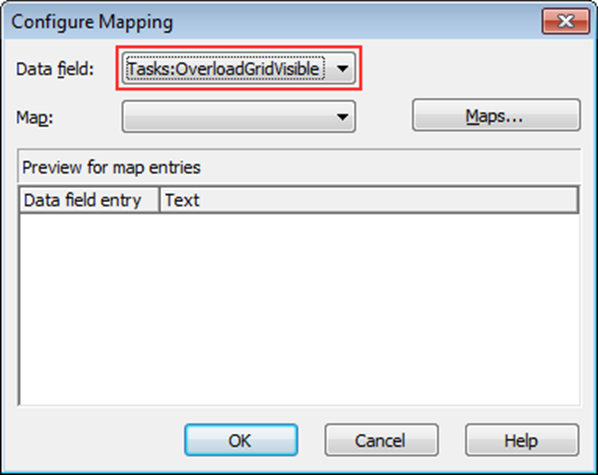
5. In this calendar grid, the visibility and the calendar being used have to be mapped:

The Visible value is taken from the data field OverloadGridVisible that is set to 0 or 1, depending on whether the overload grid is to be displayed for the respective node or not.
The values are assigned to OverloadGridVisible in the code as follows:
private void vcGantt1_MouseMove(object sender, MouseEventArgs e)
{
string histogramName = string.Empty;
object identObj = null;
VcObjectType identObjType = VcObjectType.vcObjTypeNone;
if (MouseButtons == MouseButtons.None
{
vcGantt1.IdentifyObjectAt(e.X, e.Y, ref identObj, ref identObjType);
ShowOverloadsInNodeRow(identObj, identObjType);
}
}
private void ShowOverloadsInNodeRow(object identObj, VcObjectType identObjType)
{
VcNode node;
VcNode oldNode = vcGantt1.GetNodeByID(_oldNodeID);
switch (identObjType
{
case VcObjectType.vcObjTypeNodeInDiagram:
node = (VcNode)identObj;
node.set_DataField(eTasks.OverloadGridVisible, "1");
node.Update();
_oldNodeID = node.ID;
break;
default:
if (oldNode != null)
{
oldNode.set_DataField(eTasks.OverloadGridVisible, "0");
oldNode.Update();
}
break;
}
}
6. The calendar to be used is mapped as described below:

Data field designates the field being used for grouping.
Please make sure to select the calendar grid, which will be indicated by the red triangle in the Selected column.
Want to improve the visualization of resource overloads in your .NET scheduling application? Intrigued by the idea of showing the resource bottlenecks in the node rows? Get your trial version of VARCHART XGantt 5.0 NOW and apply the above NOW!