As you might already know or have already read in my corresponding blogposts about the revised VPS user manual and VSS user manual, we did a profound and complete overhaul of our manuals for the VPS and the VSS.
Perhaps you have already missed the new manual of the VJS, our Gantt chart add-in for visual project planning with NAV's Job Planning Module? But not to worry - I'm glad to announce that a new manual for the VJS has been published today.
While reworking the VJS manual, I once again came across some features that at first glance seemed to be small and perhaps a bit trifling, but upon closer inspection showed great effect and this is why I'd like to share them with you today. To some of you they might be new - others might be glad to be reminded of them again.
Fixate histograms: Keep track of a certain resource
Both in the Job View and in the Resource View of the VJS, a histogram below the Gantt chart displays the workload of the corresponding resource. To select a resource group or resource for being visualized in the histogram, you move the mouse onto a resource group or a resource and its row will temporarily be marked by a bluish-grey background:
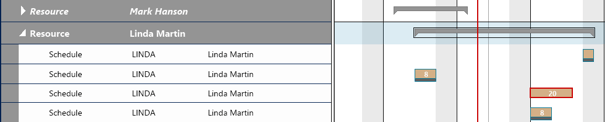
And, of course, the corresponding histogram will be displayed:
At times, this behavior could be a bit irritating since the histogram constantly changes with your mouse movements thus causing a slight "turbulence".
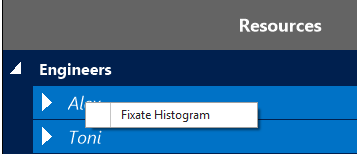
Apart from the turbulence, in some cases you might want to keep track of a certain resource by having their workload constantly in sight and therefore you'd like to have this resource's histogram be displayed permanently and independent of the mouse position. In the VJS this is done very easily - just right-click on the desired resource group or resource and select "Fixate Histogram":
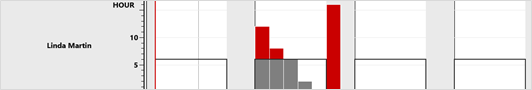
As a result
- The name of the resource group/resource is displayed in yellow:

- Only the histogram of this resource will be displayed, even when the mouse cursor is being moved,
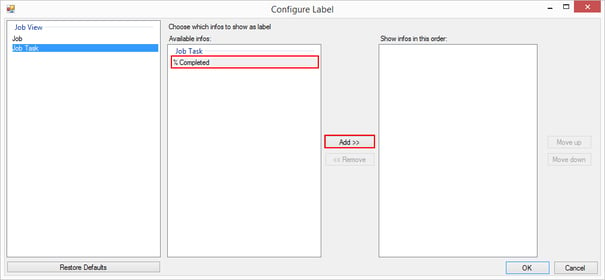
Show individually relevant information in the planning board by "% Completed" as Bar Label
If you'd like to keep control of the progress status of your jobs, you could have the field "% Completed" be used as bar label. The field will then be displayed for the job tasks per level, its calculation being based on the "% Completed" field of the Job.
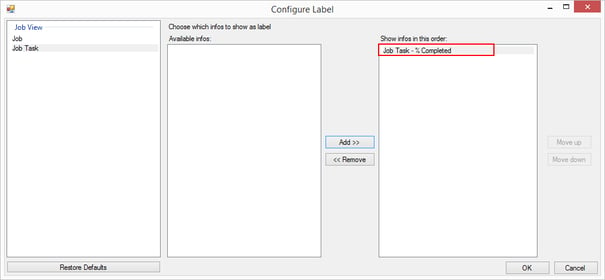
This little but effective option can be found in the "Configure Bar Label" dialog, where under "Job View" you click "Job Task" and then select the field "% Completed" to be shown as bar label by selecting it and then clicking the "Add" button.
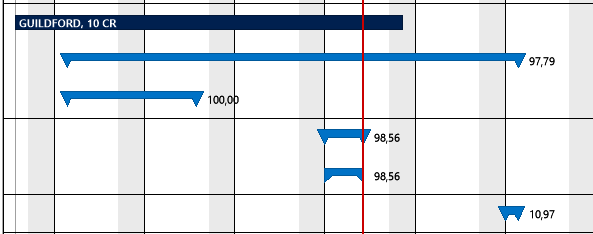
Now the field appears in the list "Show infos in this order".
After having confirmed your setting, your plan could look like shown below:
Further information
Click here for the revised manual and additional information on the VJS like the latest Release Notes and some interesting FAQs.
Want to have more tips about visual project planning? Read about the 3 most loved features of the Visual Jobs Scheduler for Microsoft Dynamics NAV.More information about Visual Scheduling for Microsoft Dynamics NAV is available in this ebook: