The Visual Jobs Scheduler (VJS) is an add-in for Microsoft Dynamics NAV, which provides fully integrated, interactive drag & drop scheduling Gantt charts for jobs and resource planning data. This Gantt add-in helps Dynamics NAV users to visually plan jobs, job tasks, job planning lines and resource allocations. This improves the project management capabilities provided with Microsoft Dynamics NAV and lets the users achieve operational agility.
This blog post introduces the recently released new version (1.2) of the Visual Jobs Scheduler highlighting its new features, and explains how they simplify and improve project planning and project management for NAV users.
Massive Reduction In The Amount Of Planning Lines By Showing "True" Duration Of A Task
As the VJS is based on the standard NAV data model, and does not require any change to the standard NAV (resulting in very fast implementation times), a graphical challenge had been the question of how to best visualize a 'task'. NAV users are familiar with the fact that a standard job planning line is 'designed' as per planned capacity utilization per day. That means that - given an 8-hour work day - a 12 hour task requires the creation of two job planning lines: one with 8 hours resource usage on day 1, and one with 4 hours resource usage on day 2. So far, the VJS has reflected this standard NAV data model: by default, one day is the bar length that is used for a job planning line. The number displayed in the bar indicates the amount of time units reserved for this job planning line. Even if the quantity of time units exceeds the resource capacity, the bar length will still have the length of one workday.
However, a new option is available now allowing the user to vary the bar length by calculating it from the dependency of the reserved quantity and the capacity of the allocated resource. In case of a job planning line with 20 hours and a resource capacity of 8 hours per day, the bar will be spread over 3 days (see Michael Holm in the screenshot below).
The benefit for the user is obvious: he can plan the entire task, i.e. in this case reduce the number of planning lines from 3 to 1. In addition to this, he can manage the true capacity utilization resulting from the 20-hours task as can be seen from the capacity load chart ("histogram") below the Gantt chart.
")
Another example: With a job planning line of 20 hours and a resource capacity of 4 hours, the bar is distributed to 5 days (Thorsten Scholl).
")
Improved Resource Capacity Management By New View: Capacity Load
In addition to the already existing project view and resource view, the VJS now offers a new view for visualizing the capacity load for all resource groups and resources, thus giving a fast overview of imminent overloads and free capacities.

Splitting of Job Planning Lines
From version 1.2 on, job planning lines can be split by a right mouse click, thus creating two new job planning lines out of one. Long job planning lines can be split into smaller units in order to distribute them to different or free resources.
Important: The mouse click leads to splitting the job planning line into two equal units that can, of course, be split further. Example: a job planning line with a duration of 20 hours gets split into two job planning lines with a duration of 10 hours each. These two lines can each be subdivided so that in the end there will be job planning lines with a duration of 5 hours each.


Moving Job Planning Lines Within One Resource Group
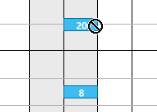
Often, resources are organized within resource groups with each resource group indicating a different kind of resource type. A typical group could be a professional services organization with the resource groups 'project manager', 'senior consultant' and 'junior consultant'. If a NAV user sets up his resource planning in this way, he now has the VJS option that job planning lines can be moved within one resource group. This means that a job planning line could be moved from senior consultant 1 to senior consultant 2, but not to a junior consultant. This interaction restriction can now be visually indicated as well. A symbol in the bar will show the planner that shifting the bar to this position is not allowed. On releasing the mouse key, the bar will jump back to its original location.
Fixate Histogram On One Resource
In the Resource View, the capacity curve for each resource is shown below the Gantt graph. If the mouse is moved to another resource, the histogram for this resource will be dynamically displayed. To prevent this, i.e. to make sure that the histogram of a selected resource/resource group will be permanently displayed, independent of the position of the mouse cursor, the histogram can be fixed to a certain resource or resource group by a mouse click.

Picture: Joe Peter´s capacity is shown, although the mouse is positioned at Mary Dempsey.
Hidden Items
Some plans use a lot of items. If there are many items placed one below the other, the planning table will be vertically inflated and, naturally, gets too confusing for the planning. A new option of the VJS makes items invisible. If job tasks of the level above are moved, the hidden items move with them "invisibly".

Visual Jobs Scheduler: show items

Visual Jobs Scheduler: hide items
Show/Hide Job Planning Lines with Quantity 0
Job Planning Lines without quantity can either be shown or hidden.
So, what to do next?
Want to see the new VJS features in action? Register to our On-Demand Webinar "What is new in VJS 1.2".
Have no immediate need, but want to catch up later this year? - We will present these and other functions of the Visual Jobs Scheduler, as well as the latest developments of our two other Gantt add-ins Visual Production Scheduler and Visual Service Scheduler at the Directions EMEA 2015 in Mannheim, Germany in October 5-7.
Visit our booth and watch our presentation! If your are interested in a detailed discussion, you are certainly welcome to make an appointment right now.